While poverty is thought to be an enduring cause of socioeconomic disadvantage, determining which people live in poverty is not a straightforward task. Examining the relationship between poverty, disadvantage and wellbeing is therefore complicated by the difficulties of determining the extent to which people live in poverty or are disadvantaged. In the past, poverty measurement has predominantly been income-based. However, due to the limitations of income measurement and the somewhat arbitrary setting of income poverty thresholds, some people who are not impoverished are counted as impoverished and vice versa. In response to these limitations, recent work in poverty measurement has endeavoured to capture measures of both deprivation and social exclusion as additional poverty indicators to better understand disadvantage.
Multidimensional disadvantage and wellbeing by Lynn Riggs, examines the measurement of different domains of disadvantage – income poverty, deprivation, and social exclusion – to develop new disadvantage measures based on the dimensionality of disadvantage. These new dimensional measures are then used to examine the relationship between disadvantage and wellbeing.
As shown in Figure 1, people experiencing more domains of disadvantage are significantly more likely to report lower levels of life satisfaction (i.e., wellbeing). For example, only 12 percent of people with no disadvantage report low wellbeing, whereas 55% of those with all three domains report low wellbeing.
Figure 1. Life satisfaction by number of disadvantage domains
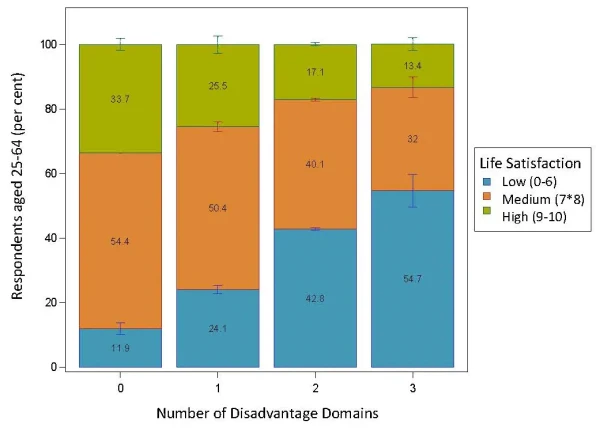
Note: Life satisfaction responses categorised as low, medium, and high. Responses are weighted to represent the population.
Why this topic?
The trends in indicators of disadvantage and social mobility in Aotearoa New Zealand are not widely understood. More importantly, there is little understanding of how these trends may affect individuals, different population groups and wider society, productivity and economic performance (New Zealand Productivity Commission, 2023). To better understand these issues, more work was needed to develop measures for the different domains of disadvantage, particularly for social exclusion, in New Zealand.
Globally, poverty measurement in the past has predominantly been income-based, and it was not until the 1970s when poverty measurement turned to non-monetary deprivation measures. This effort was led by British Sociologist Peter Townsend in his seminal book on poverty in the United Kingdom (1979). In this work, Townsend (1979) argued that poverty and low incomes limit people’s ability to fully participate in society, which became known in the literature as social exclusion (Ferragina et al., 2013). More recent work in poverty measurement has therefore endeavoured to capture measures of both deprivation and social exclusion as poverty or disadvantage indicators, though social exclusion has become less of a focus as new concepts for understanding relative advantage and disadvantage have come to the forefront. However, social exclusion is still viewed as a relevant factor to consider when developing social policy (Dean & Platt, 2016a).
Although disadvantage, or more specifically social disadvantage, is a frequent topic in the literature, it does not have an established definition. It is seen as relating to inequality and the processes through which relative advantage may be selectively conveyed (Dean & Platt, 2016b). Given this, a variety of methods and frameworks have been derived to measure and study disadvantage.
How do we measure disadvantage and wellbeing?
The New Zealand General Social Survey is primarily used to develop the measures of disadvantage and wellbeing for survey respondents. The disadvantage measures are based on indicators for the three domains: income poverty (P), deprivation (D), and social exclusion (E). The indicators for these three domains are used in a Principal Components Analysis (PCA) to determine the underlying dimensionality of disadvantage, and the PCA results are used to derive indices for each dimension of disadvantage.
The wellbeing measures are based on respondents’ assessment of how satisfied they are with their lives, how worthwhile they feel their lives are, and how their family is doing using a scale from 0 to 10. These responses are categorised as either low (0-6), medium (7-9), or high (9-10).
What are the dimensions of disadvantage?
Combining the indicators for all three disadvantage domains results in six main dimensions: Going Without (E & D), Lack of Neighbourhood Safety (E), Lack of Personal Safety (E), Labour Market Exclusion (E & P), Inadequate Housing (D), and Not Belonging (E). The letters in parentheses following each dimension indicate to which domain the main indicators originally pertained. For example, ‘Going Without’ was primarily related to items from the exclusion (E) and deprivation (D) domains.
This analysis shows that, statistically, income poverty is not a distinct dimension on its own but is, in fact, closely related to the labour market exclusion items. It is also important to note that income poverty does not load heavily with the main components of deprivation (i.e., the ‘Going Without’ measures). Therefore, income poverty and deprivation appear to be distinct dimensions of disadvantage.
This analysis also shows that PCA can be informative in classifying disadvantage indicators, particularly when some items do not align as distinctly as the domain definitions might suggest. For example, ‘Lack of Neighbourhood Safety’ and ‘Lack of Personal Safety’ might both be thought of as ‘safety’; however, statistically, these are distinct dimensions.
Overall, these results indicate there may be overlap in the three domains, despite these being conceptually distinct, and PCA can be used to statistically identify distinct dimensions of disadvantage when using many different items as disadvantage indicators. This is particularly useful given the lack of consistency or agreement on measures in the literature and It also has the added benefit of producing independent measures that can be used in the analysis.
What does this mean for wellbeing?
Although the internationally published articles on this topic focus on measures of multidimensional disadvantage, it is unclear if distinguishing these different dimensions is meaningful or useful. To examine this issue further, the paper uses the different dimensions of disadvantage in regression analysis to better understand if certain dimensions could potentially affect people’s lives differently by examining the relationship between the disadvantage dimensions and wellbeing. The results from these analyses indicate that all the disadvantage dimensions are associated with significantly lower wellbeing, as measured by respondents’ satisfaction with their lives and by their feelings of how worthwhile their lives are. Different dimensions also have different effect sizes which indicates that some dimensions may be more closely related to wellbeing than others. For example, regardless of the specification used, ‘Going Without’ has the largest negative relationship with wellbeing and ‘Not Belonging’ has the second largest negative relationship. The other four disadvantage dimensions have similar effect sizes to each other with largely overlapping confidence intervals, indicating that these dimensions have similar relationships with wellbeing.
These results show that analysing these dimensions separately could lead to different policy insights. For example, if the goal is to improve wellbeing in Aotearoa New Zealand, policy focusing on improving affordability of certain necessities may go further than policy focusing on housing improvements. It is important to stress that the results in the paper are not causal, and therefore, it is not possible to determine from these results, if disadvantage leads to lower wellbeing or vice versa. This paper does, however, show there are distinct dimensions of disadvantage and some of these aspects of disadvantage could have a greater impact on wellbeing than others.
Measures that highlight the multidimensional nature of disadvantage should be used to the greatest extent possible.
This can help us to better understand how trends in disadvantage and mobility may affect individuals, different population groups and wider society.
References
Dean, H., & Platt, L. (Eds.). (2016a). Preface. In Social Advantage and Disadvantage (p. 0). Oxford University Press.
Dean, H., & Platt, L. (Eds.). (2016b). Social Advantage and Disadvantage. Oxford University Press. https://doi.org/10.1093/acprof:oso/9780198737070.001.0001
Ferragina, E., Tomlinson, M., & Walker, R. (2013). Poverty, participation and choice: The legacy of Peter Townsend. Joseph Rowntree Foundation. Poverty, participation and choice | Joseph Rowntree Foundation (jrf.org.uk)
New Zealand Productivity Commission. (2023). A fair chance for all: Breaking the cycle of persistent disadvantage. https://www.productivity.govt.nz/inquiries/a-fair-chance-for-all/
Townsend, P. (1979). Poverty in the United Kingdom. Allen lane and Penguin books. www.poverty.ac.uk/free-resources-books/poverty-united-kingdom