Search the site by keyword

Productivity by the numbers 2023

Foreword

Ka tangi te tītī
Ka tangi te kākā
Ka tangi hoki ahau
Tihei Mauri Ora

For someone who openly admits to a love of cricket and of numbers (and, yes, there is a correlation), a document titled Productivity by the numbers puts me very much in my happy place.

Just like in cricket, the numbers are but a taster or teaser of the action to be uncovered. Uncovering the range of influences on the numbers – interrogating what drives them, and beyond – advances us to a happy place where understanding and insight abounds.

In cricket, there are a range of tactics and strategies available to teams from which a potentially winning combination needs to be chosen as part of an overall gameplan. Likewise, there are a range of perspectives on productivity: what is productivity and how can it be improved, what is the aim, is there a pay off – and, for some, why bother?

Clearly and unambiguously, improved productivity is about reaping more for less. But this is where the clarity ends and the ambiguity begins. Differing perspectives revolve about answering the question: more of what? And, conversely: less of what?

The conventional view responds with more outputs – more goods produced and more services delivered. These “more goods and services” need to be delivered using fewer productive factor inputs – (for example, land, people-hours, raw materials, machinery and equipment). More material outputs for fewer resource inputs is consistent with the view that the provision of such goods and services drives material incomes and better living standards.

This is the perspective of productivity that is the subject of interrogation in this document – partly because we have reasonably good numbers to support such an interrogation, and partly because it is the perspective that we most understand. That said, we do not overlook or ignore other aspects of productivity and the determinants for its improvement.

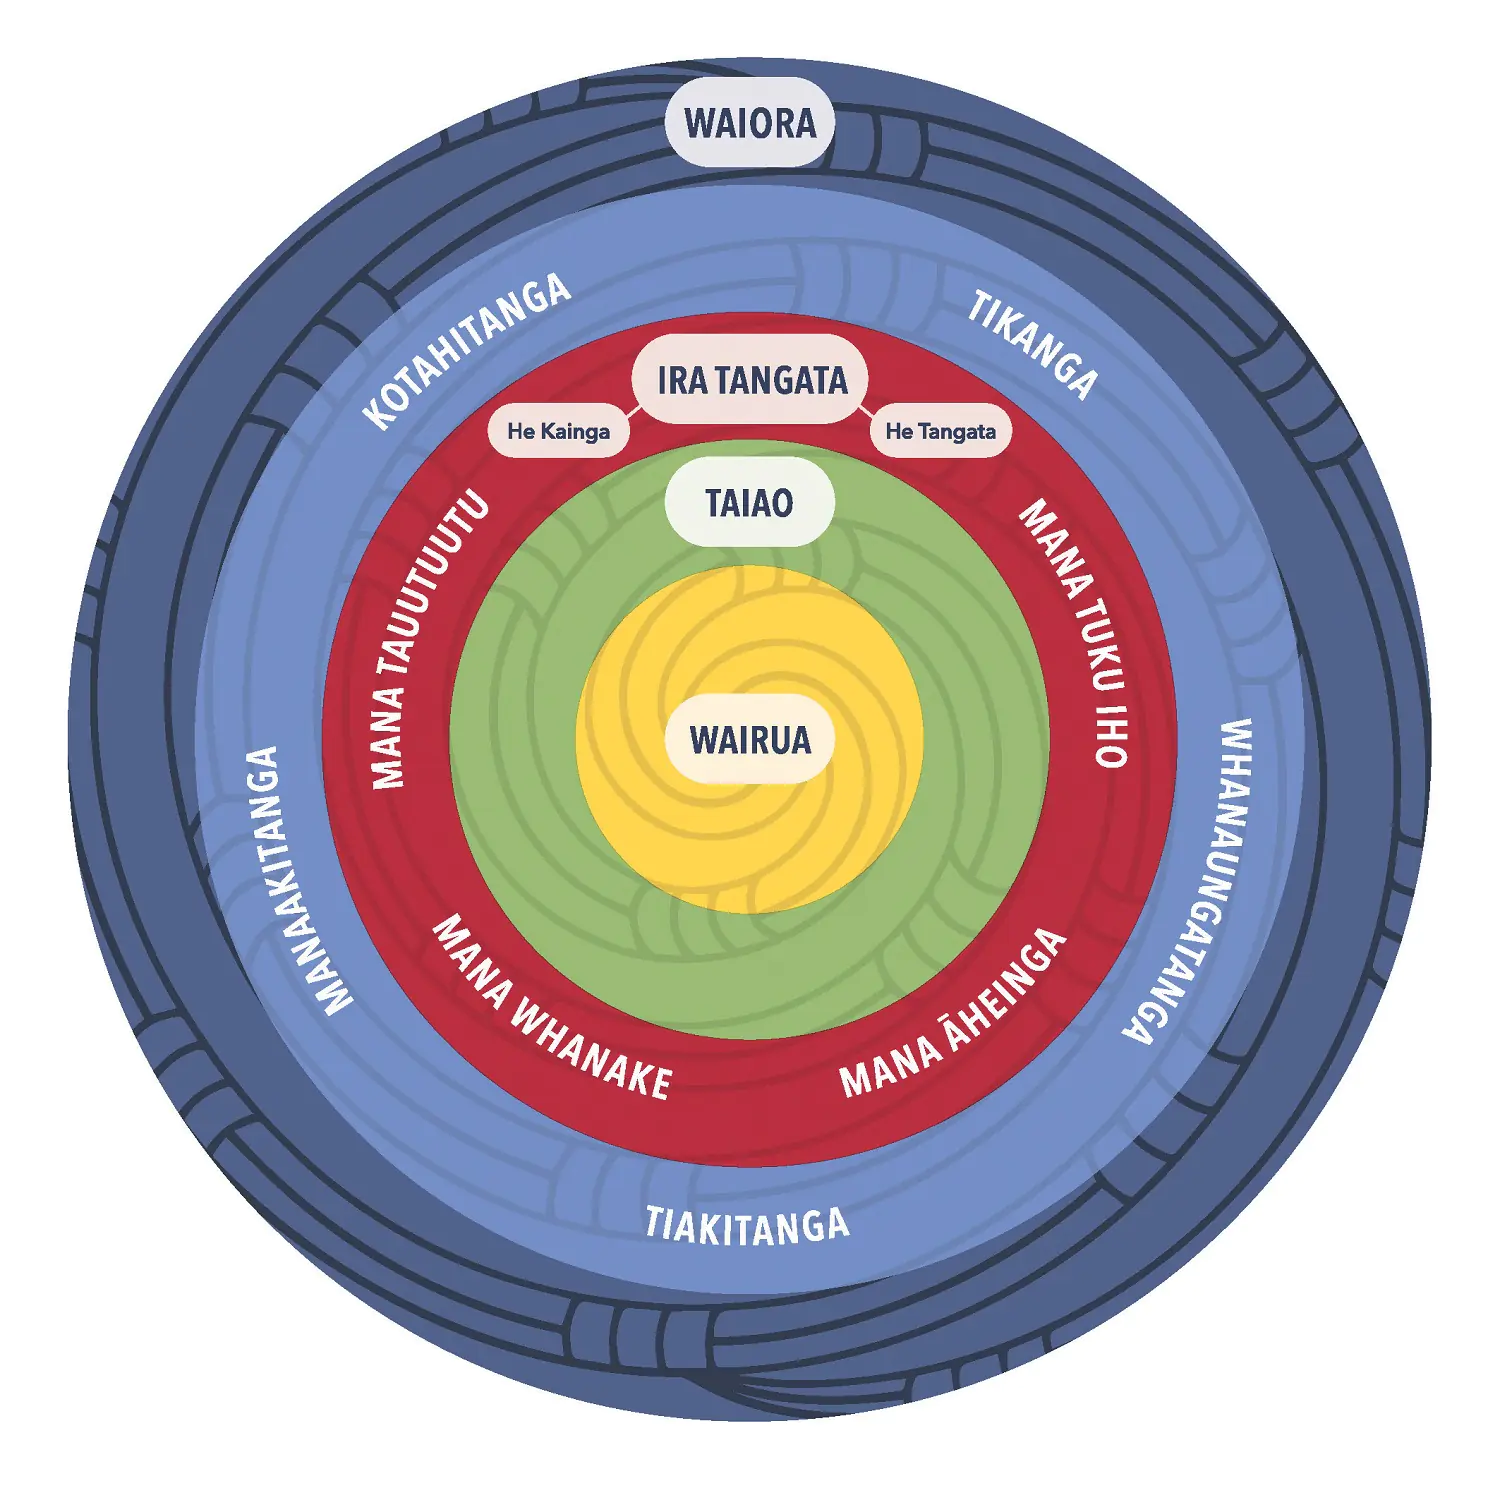
He Ara Waiora and Treasury’s Living Standards Framework capture elements of broader perspectives. As depicted in the Living Standards Framework, strong institutions and governance (for example, in firms, markets and civil society) contribute to living standards, alongside wealth reflected in social cohesion embraced by culture. The realms of te taiao, ira tangata, and wairua (the natural, human, and spiritual worlds), as depicted in He Ara Waiora, also contribute to a broader view of productivity and wellbeing, alongside a range of values like kaitiakitanga and manaakitanga.

So, alongside more outputs, improved productivity needs to encompass other non-material elements. For example, we strive for more family time and leisure hours, a sense of better community connection and cohesion, opportunities to feed both the mind and the body, and we strive to strengthen the foundation and legacy our descendants will inherit. The health of the spiritual world also features highly in the basket of needs that influence the desire to reap more.

As for the “less” side of the equation, in addition to fewer productive factor inputs, improved productivity would require fewer potentially harmful activities, such as culturally unacceptable behaviours, or the promotion of addictive substances and gambling attractions, or production that causes ecological degradation and depletion.

Acknowledging these broader elements reinforces that any discussion of productivity (and, yes, the numbers) should focus on adding to the understanding of, and insights into, the influences driving productivity and their impact on wellbeing. Sadly, as this document reflects, the insights provided by the interrogation of the numbers highlight challenges to be addressed.

The numbers indicate that the productivity record of Aotearoa New Zealand leaves a lot to be desired. The nation has a relatively defensible record in producing more goods and services. But much of this has been through the use of more (rather than fewer) productive factors and/or engaging in more (rather than fewer) harmful or depleting activities. In a nutshell, more goods and services have been delivered by more hours being worked by more people, alongside an increase in some harmful activities. This is not a recipe for sustained improvements in material living standards, let alone those non-material aspects of family time, leisure hours, and feeding the mind as well as the body.

Consequently, the recipe we must adopt is to focus on the “less” side of the equation. As discussed in this document and supported by the findings of recent inquiries we have undertaken, investment effort is central to this recipe – whether in supporting development of innovation ecosystems; striving for low-emissions production processes; developing an immigration (and population) outlook consistent with the physical and community infrastructure; or aiming for a fair chance for all, to underpin our social contract.

In short, improving productivity requires efforts (that is, investments) to maintain, enhance and improve the capabilities and qualities of the range of productive factors, institutional arrangements, and resources on our watch. And, as for any investments, these efforts need to be sustained and exercised over a longer term – across years, decades and generations.

For, just like cricket again, the one-day and T20 fly-by-nighter versions of the game are for those satisfied by an inevitably transitory fix. However, as true cricket lovers will understand, the longer form of the game is the more rewarding – a true test of skills, tactics, strategies and understanding. Investment efforts over the longer term are not only where further material rewards lie, they are also where enjoyment of better living standards and wellbeing across other dimensions can emanate from successfully lifting our productivity numbers.

Ngā mihi nui,

Dr Ganesh Nana

Chair, Te Kōmihana Whai Hua o Aotearoa | New Zealand Productivity Commission

Key points

Productivity matters for wellbeing

  • Achieving higher productivity improves our overall wellbeing, by increasing the nation’s incomes and our ability to produce and afford the goods and services that underpin a happy, healthy life.
  • This allows us to invest in public goods and services that benefit everyone, such as schools, hospitals and infrastructure
  • Improved productivity also enables us to enjoy more time with family, whānau, friends and community, and spend more time on improved collective wellbeing, and pursue social and envinronmental goals.
  • The distribution – across and within groups and communities around the rohe – of the gains from higher productivity also matters for individual and overall wellbeing.

Aotearoa New Zealand’s productivity growth has declined

  • New Zealand’s economy has gone from being one of the most productive to one of the least productive in the OECD.
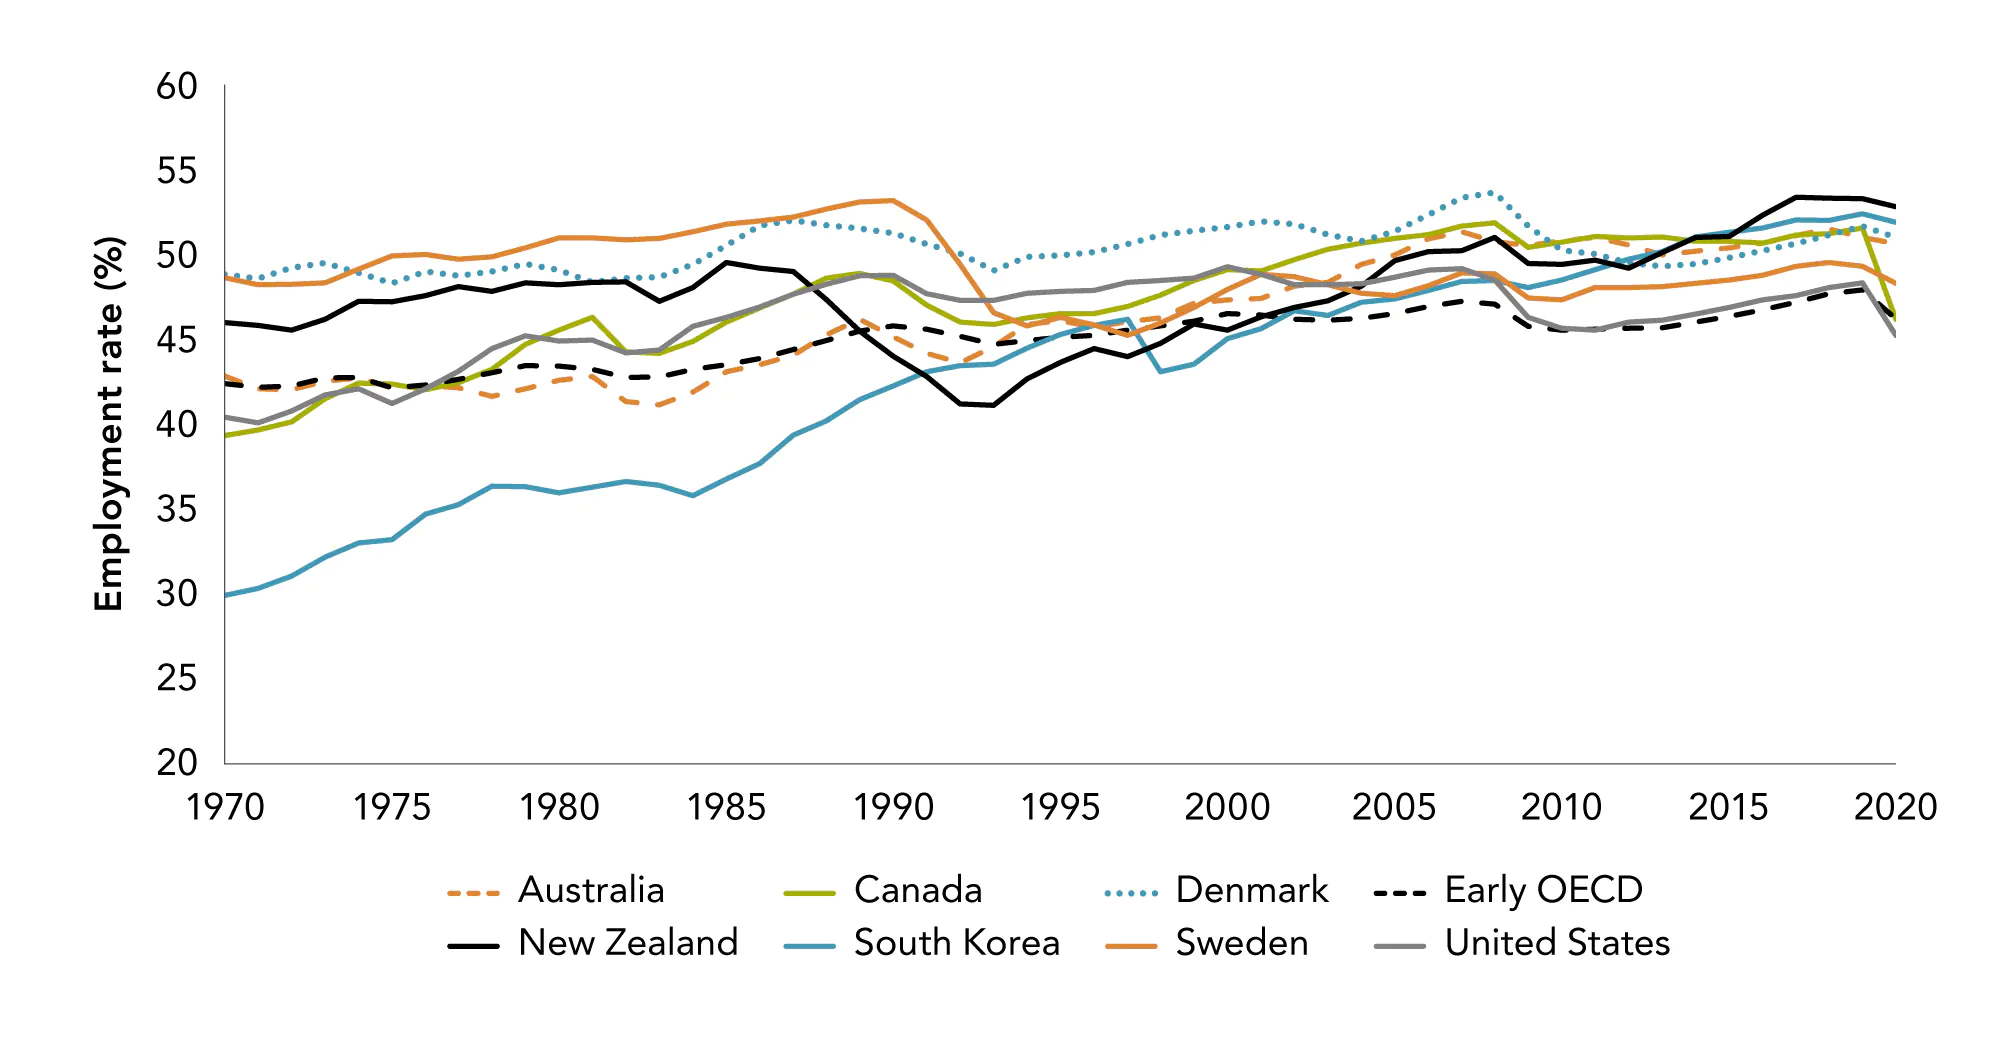
  • Working more hours and putting more people into work has been the main way that production and income have grown over the last decades.

Innovation and investment are keys to lifting productivity

  • Innovation and technological change, which require appropriate investment efforts, are critical to productivity growth.
  • The Government’s efforts need to be focused, aligned, well connected to businesses, iwi, Māori, researchers, and workers, and well evaluated, to enable learning and adaption.

Productivity requires a long-term commitment

  • Aotearoa New Zealand’s current productivity is built on decades of investment – in skills, knowledge, ICT, infrastructure, institutions, relationships, and the environment.
  • This investment effort needs to be not only continued, but also lifted and honed to ensure improved resources and inputs are fit-for-purpose for the 21st century.
  • The choices we make today influence the productivity and standard of living, waiora, and wairua tomorrow, and for future generations.

Part 1 | Productivity matters

Productivity is how we engage with our people and communities to deliver on our commercial and cultural objectives for our shareholders and owners in a way that is best for our people and environment, while optimising our performance, and maximising our returns. This te ao Maori thinking means this is entirely achievable.

Traci Houpapa & Liz Mellish | Chairs Federation of Māori Authorities


The long-term prosperity of Aotearoa New Zealand depends in large part on its productivity. Productivity is a measure of how well an organisation, industry or country is using the resources available to it. Productivity is most usefully seen from a longer-term perspective. The investments we make in our people, communities, infrastructure, institutions, and knowledge will determine the lives we are able to lead, and those of our children and future generations.

Although having more to go round does not automatically translate to a higher level of wellbeing for all, our ability to do more with less can make it easier to make growth sustainable, providing higher living standards for both current and future generations. Improved productivity also enables us to enjoy more leisure time, spend on improved collective wellbeing, and pursue social and environmental goals. Sustainable economic growth provides future generations with more opportunities to meet their needs and respond to unforeseen challenges.

Productivity by the numbers explores how the Aotearoa New Zealand economy transforms inputs into outputs. We begin with a discussion of the role that productivity growth plays in supporting sustainable improvements in material living standards, and of the links between productivity and wellbeing. Part 2 looks at how productivity is measured, including the limitations of standard productivity measures. Part 3 describes the trends in New Zealand’s productivity performance and compares our economy with other countries around the world. Part 4 explores the underlying determinants of productivity and assesses New Zealand’s current performance in these areas. Finally, in Part 5, we discuss the role of government in supporting sustainable productivity growth.

This report sets the scene for a broader public understanding and debate by drawing out where Aotearoa New Zealand has done well and where we could do better. It also looks at the development of policies to improve the performance of our economy and the wellbeing of our people.

1.1 Productivity and wellbeing

Productivity growth is not just about producing more output. Increasing productivity is about getting more (output) for less (input) – not about people working harder, wearing out plant and machinery, or depleting natural resources. Aotearoa New Zealand needs a more productive economy to improve material living standards and wellbeing, particularly with an ageing population, and the way we achieve this productivity growth must reflect the unique aspects of our history and society, including our founding document, Te Tiriti o Waitangi. This is reflected in the Productivity Commission’s statutory objective:

…to provide advice to the Government on improving productivity in a way that is directed to supporting the overall well-being of New Zealanders, having regard to a wide range of communities of interest and population groups in New Zealand society.

New Zealand Productivity Commission Act, 2010, s 7

There are many ways to describe the concept of “wellbeing”. Some emphasise levels of happiness experienced by people (Layard & Layard, 20 1; Layard, 2006), and others centre around the ability of people to enjoy lives of their choosing (Nussbaum, 20 1; Nussbaum & Sen, 1993; Sen, 1985, 2003). These measures can be based on the sum of individual wellbeing or can include community-wide measures. Acknowledging the unique aspects of Aotearoa New Zealand, Treasury’s Living Standards Framework (LSF) denotes culture as surrounding the nation’s wealth (Figure 1.1), and He Ara Waiora depicts a tikanga framework that conceptualises a Māori perspective on wellbeing (Figure 1.2).

Figure 1.1 The Treasury's Living Standards Framework

Figure 1.1 The Treasurys Living Standards Framework

Source: The Treasury, (2021), p. 2.

Material living standards have a bearing on most definitions of wellbeing (for example Carver & Grimes, 2016; Deaton, 2008). However, the relationship between material living standards and wellbeing is not straightforward. There are many other influences on current and future wellbeing. This has led several national and international agencies to develop broader frameworks to drive policy design, delivery, and assessment.

The LSF describes individual and collective wellbeing as being a function of 12 domains that “reflect what research and public engagement have shown are important for the wellbeing of both individuals and collectives...” (The Treasury, 2021, p. 11).1 This includes, but is not limited to health, knowledge and skills, cultural capability and belonging, as well as income, consumption and leisure (Figure 1.1).

The framework also highlights the role of “wealth” – the natural environment, social cohesion, human capability, and financial and physical capital. The place of “culture” in the LSF is a little ambiguous.

We have added culture at the bottom of the framework to emphasise that all aspects of our wealth, our institutions and our wellbeing are cultural – culture is in every part of the framework. The Treasury (2021) Living Standards Framework, p. 3

This suggests there are in fact five aspects of our wealth. Nevertheless, productivity is highlighted as an important element spanning the whole of the framework.

Productivity growth is an important driver of improving living standards and wellbeing for us in Aotearoa New Zealand. In the widest sense, productivity is about making the best use of all four aspects of our wealth to generate as much wellbeing across the 12 domains as possible. The Treasury (2022) Te Tai Waiora, p. 17

There are other frameworks that provide an understanding of wellbeing in different contexts. He Ara Waiora (Figure 1.2) provides a mātauranga Māori perspective, emphasising the connection between the physical and spiritual worlds2 as an expression of wellbeing. Others include Fonofale for a Pacific perspective on wellbeing (for example Foliaki, 2001), and the Children’s Commissioner’s (2018) Wellbeing Wheel for a perspective on children’s wellbeing.

Wellbeing itself, and other elements that contribute to wellbeing (such as general health and trust in institutions and other members of society), also improve productivity. We have long known that economies with low levels of trust do not function as well as those with higher levels of social capital (Knack & Keefer, 1997; Solow, 2000). Research shows that satisfied workers are more productive (Böckerman & Ilmakunnas, 2012; Oswald et al., 2015). A more engaged workforce with fewer days off sick improves productivity of the workplace and the economy.

Figure 1.2 He Ara Waiora

Figure 1.2 He Ara Waiora

Source: The Treasury, (2022), p. 19.

Actions that raise what psychologists call “affect” can themselves improve productivity (Oswald et al., 2015). Positive affect has been shown to increase cognitive flexibility (Isen, 2008); reciprocity (Kirchsteiger et al., 2006); work effort and productivity (Erez & Isen, 2002; Oswald et al., 2015); and attitudes to risk (Erez & Isen, 2002; Ifcher & Zarghamee, 20 1; Isen, 2008; Isen & Geva, 1987).

Engaging in economic activity can also enhance wellbeing. One of the most consistent relationships with wellbeing found in empirical wellbeing research is the negative impact of unemployment (Clark & Oswald, 1994; Flatau et al., 2000; Riggs, forthcoming). This effect is over and above the direct impact of the loss in income (Winkelmann & Winkelmann, 1998), and is also associated with voluntary work (Yeung et al., 2018). Beyond early mornings, the sweat of toil and bad bosses, participating in the economy also brings fulfilment and community.

That is not to say that one cannot work too much. In recent years there has been renewed interest in the relationship between the number of hours worked and productivity and wellbeing (Liu et al., 2019; Pencavel, 2015). Sometimes it is not so much the number of hours they have worked that is important for people’s wellbeing, rather, it is the control they have over the amount of work they do (Bassanini & Caroli, 2015).

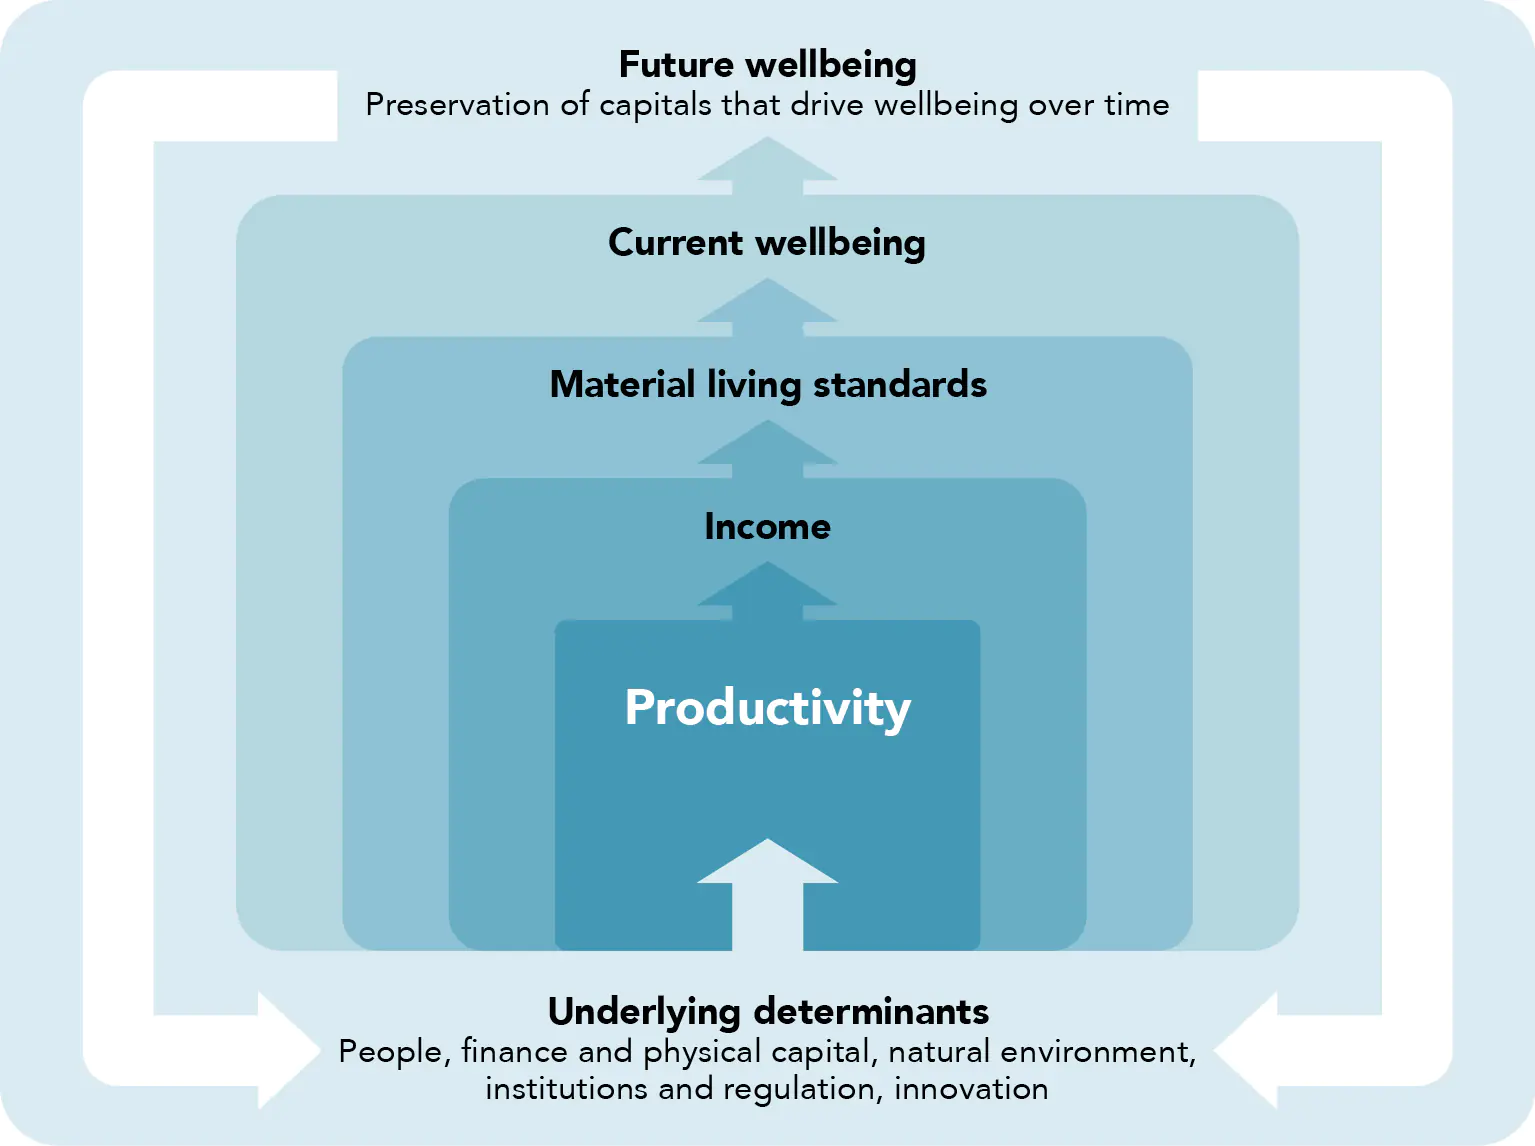
Although wellbeing is a much broader concept than income or material living standards, a critical ingredient for overall wellbeing is our ability to produce and purchase the goods and services we want or need. The primary focus of this report is on the contribution of productivity to growing incomes, which in turn contributes to higher material living standards (Figure 1.3). Material living standards are primarily determined by a country’s ability to efficiently produce goods and services – both for domestic consumption and for export to other countries, enabling other goods and services to be imported (for direct consumption or as inputs to further production).

Figure 1.3 How productivity relates to current and future wellbeing

Figure 1.3 How productivity relates to current and future wellbeing

Material living standards are just one (albeit important) part of current wellbeing. Our future productivity and wellbeing will be a function of how we maintain and develop our people, capital and the environment. Part 2 and Part 3 of this report focus on the production aspect and the factors underlying our ability to produce goods and services, and Part 4 looks at the geographical, environmental, institutional and policy determinants that underpin current production, which are built on past investments in building our individual and collective wealth.

1.2 How are productivity gains distributed?

At an aggregate level, productivity growth improves material living standards. However, it does not follow that everyone’s individual wellbeing, material living standards, income or consumption improve with higher productivity.

Governments play an important role in supporting economic inclusion and determining how the benefits of greater productivity are shared

Even when economies are performing well, the process of productivity growth can be painful. When market shares or resources move from less productive to more productive firms and industries – with some closing or shrinking, and others opening or expanding – some people benefit from new opportunities and higher incomes, while others experience disruption and job uncertainty. Public policy has an important role to play to ensure that the gains of productivity growth are shared, and that the pains do not fall disproportionately on those worst off, or those who have least ability to influence decisions that affect them.

Unequal outcomes can affect wellbeing directly. They can also reduce future wellbeing through their impact on productivity. If poor families cannot afford quality housing, this has a direct effect on their wellbeing as well as longer-term effects on their ability to work or attend school. Work by Riggs et al. (2021) suggests that overcrowded, cold, damp or mouldy homes led to an average of 6,000 hospital admissions annually between 2010 and 2017, with an estimated cost of $36 million per year. These direct costs may be dwarfed by the impact of time away from work or school. For example, falling behind at school reduces options later in life and reduces future productivity and earnings.3

What is the potential for regressive impacts?

Aggregate productivity measures do not tell us much about how the benefits of productivity are distributed. Other measures can give us a broader picture, but interpreting these is difficult (Box 1).

Productivity growth can be an important levelling force. When economies underperform, it is typically the least skilled, qualified or experienced people, and those with the fewest social and economic resources, who are worst affected. Inequalities tend to increase where productivity growth is weak, because some people have fewer options than others (Hoynes et al., 2012; OECD, 2015). People with high or above-average educational attainment, and those starting life with a lot of resources, have more opportunities and may be more able to adjust or relocate to find more productive, higher paying jobs.

Box 1 Productivity measures reveal little about the distribution of material living standards

Who gains from productivity growth? The labour income share (LIS) is one way of measuring how productivity gains are allocated; it indicates how national income is split across inputs to production. There are two reasons to focus on the LIS. The first is that labour is the main source of income for most of the population. The second is because it is the simplest to measure, as most payments to labour are directly observable.4 The difficulty comes in interpreting the remainder. Most of the remaining part of national income is generally considered to be the return to capital expected under perfectly competitive conditions, sometimes called the capital income share. However, this residual could also be due to an increase in firms’ market power leading to higher economic profits; the undermeasurement of capital because of assumptions about depreciation and obsolescence, or unmeasured capital such as intangible or organisational capital; or the emergence of a gap between the return on risk-free bonds and the cost of capital that firms perceive when making their investment decisions (Karabarbounis & Neiman, 2019).

There have been long-term declines in the LIS across the world, particularly since the Global Financial Crisis (GFC) (Karabarbounis & Neiman, 2014; Piketty, 2018; Stansbury & Summers, 2020). This has led to concerns about growing inequality and whether the benefits of economic growth are being widely shared.

Most studies of the LIS in Aotearoa New Zealand have focused on the period since the 1970s, showing a long period of decline in the labour share through to the early 2000s, followed by a period of recovery (Bridgman & Greenaway-McGrevy, 2018; Conway et al., 2015; Reddell, 2017) until declining again from 2009. In contrast, Partridge & Wilkinson (2019) argued that the decline halted in 1991, after which the LIS again trended upwards. Bertram & Rosenberg (2022) and Rosenberg (2017) took a longer-term perspective, showing that the declines since the 1980s followed a long period of increasing LIS in the post-war period. The long-term picture places the current LIS at higher than it was 80 years ago, but lower than it was in 1981.

Bridgman & Greenaway-McGrevy (2018) attributed the decline since the mid-1980s to the decline in public sector employment as government trading enterprises were corporatised as part of public sector reforms. Bertram & Rosenberg (2022) tackled the apparent lack of impact of the Employment Contracts Act 1991 on the falling labour share. They found that a decline in real wage rates coincided with a rise in employment and reversal of high unemployment, which peaked at 11% in the year to March 1992. When the employment rate is considered, there was a statistically significant structural break in that year. This is consistent with significant reductions in employee bargaining power and social supports (which occurred in the same period). Allan & Maré (2022) found evidence of significant economic rents using firm-level data from 2002–2018 and found that economic rents accrue primarily to owners of capital rather than to labour.

Recent developments have enabled sophisticated decompositions of the changes in the labour share. For example, Karabarbounis & Neiman (2019) found that half of the decline in the global labour share can explained by the shift away from labour caused by the decrease in the relative price of investment goods (such as information technology). Barkai (2020) found a falling capital income share, but this was more than made up by rising pure profits which he considered to be the primary explanation for the fall in the US labour share. Finally, De Loecker et al. (2020) found rising average economic rents since the 1980s are due not to firms raising their profit shares, rather, they are due to the reallocation of economic activity to more profitable firms (in what has been called the rise of “superstar firms”) (Autor et al., 2020).

A decline in the LIS is not necessarily evidence of falling material living standards at the lower end of the income distribution. Indeed, in many countries, mean wages have been rising, but median wages have been stagnating. This implies an increase in inequality within the labour share. Evidence suggests that this is due to a mixture of increasing returns to skills and allocation of labour to high-productivity firms, rather than the LIS declining in the average firm (Autor et al., 2020). There have been a vast array of reasons given for this, from the decline of unionism to increased use of robots (Grossman & Oberfield, 2022).

If productivity growth is fast enough, real wages could still be rising at a reasonable pace, even when the LIS is falling. This may be preferable to an economy in which the LIS is constant because real wages and productivity are both stagnating. On the other hand, growing inequality could lead to social consequences and resistance to change – which itself can hold back productivity growth.


Weak productivity performance may affect low-income consumers more than high-income consumers. Productivity growth typically makes goods and services cheaper, better, or both – freeing up money for other purposes. Conversely, where poor productivity results in higher prices for significant items of household expenditure, this imposes a larger burden on the budgets of those who are less well off.

Another aspect of productivity growth that may affect the distribution of income is the nature of technological change. Some technology substitutes for skills – such as mechanical looms replacing stocking knitters, and generative AI writing company reports (Johnson, 2023). Other technology increases the demand for skills, or “skill-biased technical change” (Autor et al., 2003; Card & Lemieux, 2001). If the substitution effect dominates, then the effect will be to compress the wage distribution. If skill-biased technical change dominates, the effect will be to increase inequality. The results of empirical work are ambiguous and appear to vary by country and institution (Battisti et al., 2022). The Commission’s Technological change and the future of work inquiry report (NZPC, 2019), provides more information on this subject.

The net benefits of productivity growth for individuals depend on their personal circumstances and their current skills and experience. For example, where industries compete against overseas producers, the benefits from improved productivity manifesting in lower prices and new products may go to consumers, but not to domestic firms and their workers. The process of resource reallocation – where some firms close or shrink and others expand – can be disruptive to families, communities, industries, and regions, especially those with few other choices.

Productivity growth is important for overall income growth.

real wages firms pay their workers increase more rapidly when productivity growth is strong and that higher real wage increases are more likely in high-productivity growth industries.

Fraser (2018)

International studies show that the lowest decile/quintile of workers within a country benefit at least as much as the average worker from economic growth (that is, inequality does not tend to increase with economic growth at many stages of development) (Cerra et al., 2021; Dollar et al., 2015; Dollar & Kraay, 2002). Income growth not only directly matters for the material living standards of households, but it also enables governments to redistribute income and wealth to address inequality and hardship. However, tackling inequality and hardship requires an understanding of how people’s circumstances differ, in order to design and deliver effective policies (Davies et al., 2022).

Productivity growth plays a crucial role in improving our overall wellbeing by increasing the nation’s incomes and our ability to produce and afford the goods and services that underpin a happy, healthy life. It also gives us the option to work fewer hours and enjoy more free time. Additionally, higher incomes allow us to invest in public goods and services that benefit everyone, such as schools, hospitals, and infrastructure. Higher productivity promotes the growth and prosperity of Aotearoa New Zealand to safeguard our wellbeing, today and in the future. By providing more income to invest in our nation’s wealth and using our existing resources more efficiently and sustainably, we can create a brighter future and better quality of life for all New Zealanders.

1 The last iteration of the LSF was updated to include “the concept of collective wellbeing to reflect the importance of families, whānau and community to the wellbeing of Māori, Pacific Peoples, and many other New Zealanders” (p. 2).

2 Ira tangata, taiao and wairua.

3 For example, Aotearoa New Zealand research suggests that students who leave school without qualifications earn half as much those who left with NCEA Level 2 (Scott, 2020).

4 It is, however, more difficult to examine returns to labour accruing to the self-employed than it is to

Part 2 | Accounting for productivity

Productivity is all about the ‘why’, ‘what’ and ‘how’ we utilise and combine people and resources to leave a better world for future generations, being in service of human dignity and upholding the mana of te taiao.

Tania Pouwhare (Ngāi Tūhoe) and Chrissie Hape | Chairs, Māori Economic Development and Advisory Board (MEDAB)


In Part 1, we introduced productivity as a concept, and related it to income, investment, and wellbeing. This publication is about the numbers, so to move from theory to evidence, there are several important things to consider when we seek to measure productivity and understand what we find.

“Productivity” measures how well an organisation, industry, or country is using the resources available to it. It is calculated as the ratio of the volume of output produced, relative to the volume of inputs (such as labour and capital) used (Hulten, 2007; Schreyer & Pilat, 2001). Measures of volume are a combination of both quantity and quality, meaning that output measurement captures economic value. For example, productivity can increase if the number of apples produced go up. But productivity can also increase if the apples get tastier and people are willing to pay more if a new type of apple is produced, or if a more efficient method of harvesting is developed.

Innovation lies at the heart of productivity growth.

Most of the growth in productivity and material living standards over the centuries has come from combining inputs into new products and services – such as antibiotics and anti-slip mats – rather than from improving processes to be more efficient hunters or gatherers (Stevens, 2011). Some of these advances have been marginal and others pervasive. General purpose technologies (such as steam power, electricity and computing) are technologies that are widespread, improve over time and can set in motion complementary innovation to support and build off them (Bresnahan & Trajtenberg, 1995). These complementary investments lead to impacts and assets that are hard to measure, so it takes time to understand their impact (Brynjolfsson et al., 2021). This can lead to an ongoing race between technology and measurement, as people find new things to do and ways to do them that were not envisaged a generation ago, and statistical agencies update their methods as existing measures cover less of the economy.

2.1 Production, income, and consumption

The national accounts of a nation paint a picture of the production that occurs, the income earned, and the expenditure on goods and services. The most common measure of what Aotearoa New Zealand produces is Gross Domestic Product (GDP). This measures the amount of goods and services produced in New Zealand, including goods produced for export. Imports are not included, because they are produced abroad.

The economy is a complex system of production and exchange. One firm’s outputs are another firm’s raw materials. To prevent double-counting, national accounts measure the value added by each firm, over and above the inputs they use. Economists and national accountants describe the inputs as “intermediate consumption” because they are “consumed” by the process of production. For example, in a bakery, the ingredients used are considered as intermediate consumption, while the value of the bread is called “gross output” – it is the total value of the output. “Value added” is gross output less intermediate consumption, and GDP is the total of the value added of all market production taking place in Aotearoa New Zealand.

Of course, not all the flour and yeast produced in Aotearoa New Zealand is used by bakeries. Flour sold to make cheese scones in household kitchens is itself considered a final output, so its contribution to the nation’s production is the value added to the flour over the grain that entered the mill.

This highlights an issue with national accounting: the production taking place within households or in other community places is difficult to measure and is, therefore, excluded from the national accounts. Accordingly, homemade cheese scones, along with home childcare and DIY, do not appear in the official national accounts. This exclusion in most measures of GDP introduces a gender bias to GDP in societies where roles such as unpaid care work and housework tend to be gendered (Studenski, 1958; Waring, 2018; Waring & Steinem, 1988). Alternative measures, including “non-market production” (such as that in households), have been produced since the 1970s (for example, Ahmad & Koh, 20 1; Chadeau, 1992; Nordhaus & Tobin, 1973). Other examples include whānau and hapū members maintaining whare, marae grounds, and urupā. Similarly, the efforts of volunteers preparing food in wharekai, or kaiako helping with kapa haka training, are also excluded from the national accounts.

Production, prices, and income

Prices complicate matters. The prices of goods and services tend to rise, and national accounting generally must start from nominal values, in part because it is far too complex to count every good produced or service provided and then aggregate them. For example, it is simple to add up the numbers of loaves of bread and – no matter what the price of the bread – we can work out whether we are producing more or less. However, what about wholemeal vs white bread? Bread vs butter? Bread and butter vs wine and cheese? Food vs fence posts and accounting software? Because most goods and services – and the capital and labour used to produce them – are exchanged in markets, these inputs and outputs can be valued at the prices paid for them. At any given time, we can use relative prices to add things up, but prices evolve differently over time. Because of this, real GDP deflates nominal GDP with a price index calculated by looking at how the prices of products and services change.5

What if the price of Aotearoa New Zealand exported goods change relative to imports? If no activity within the country raises its productivity, yet prices of our exports go up, or the prices of our imports go down, New Zealanders can purchase more goods and services. Such changes are favourable shifts in the country’s “terms of trade”.

Similarly, if Aotearoa New Zealand producers shift to products that earn more abroad, and we import goods that cost less, we will gain in terms of the income we earn and the consumption we can afford, despite being no more productive in terms of GDP. These types of changes show the importance of relative prices for understanding how production translates to income and purchasing power, and therefore how it affects material wellbeing.

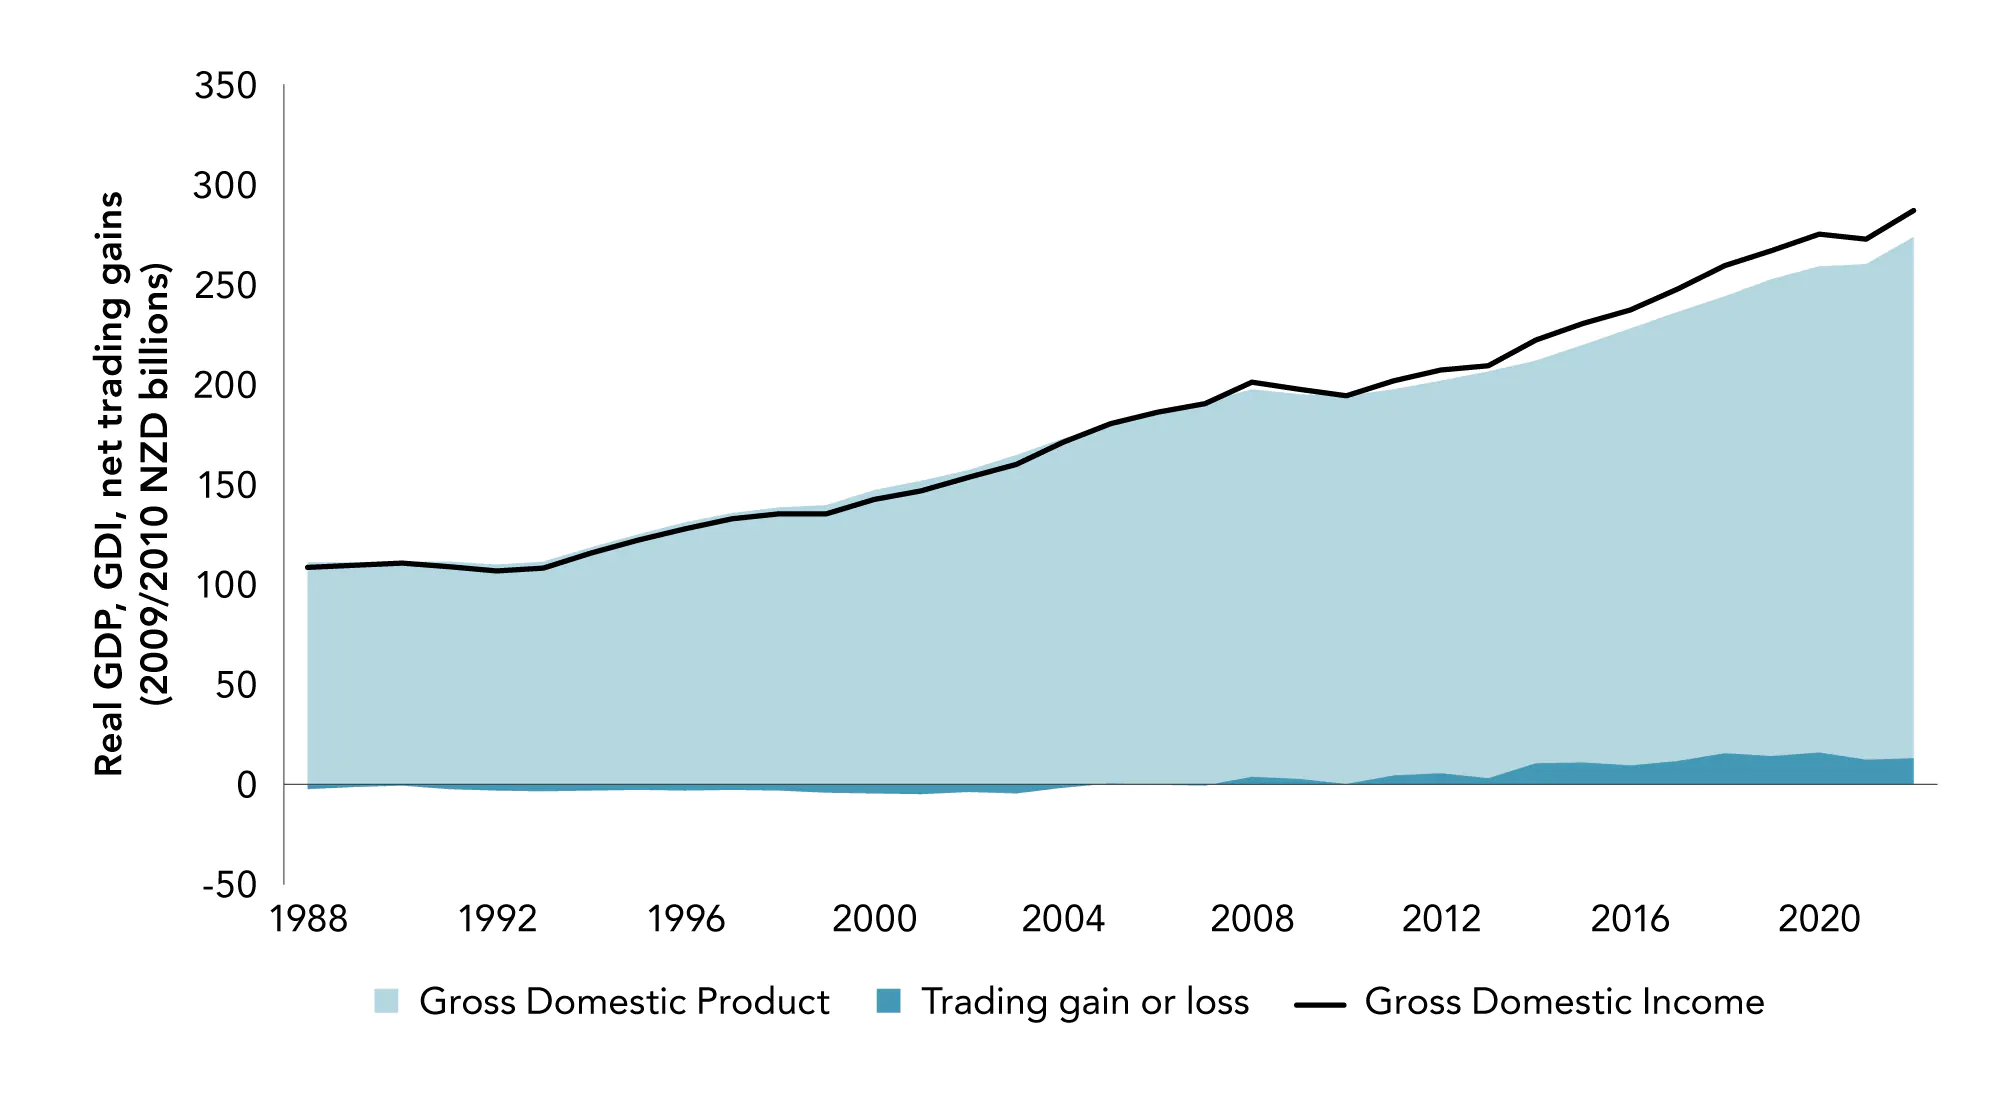
The impact of the terms of trade for Aotearoa New Zealand is shown in Figure 2.1. The light blue area shows New Zealand’s GDP since 1988, while the dark blue shows the effect of changes in the relative prices of exports and imports. In national accounting terms, this relative price is called the terms of trade, and it creates a gap between growth in real incomes (or Gross Domestic Income (GDI)) and growth in production (or GDP). This gap is called trading gains (or losses). Prior to 2010, GDI growth in New Zealand closely mirrored GDP growth. Since then, relative price changes have led to a growing divergence between the two – an increase in trading gains – with real income increasing more strongly than it would have been if based on output growth alone.

Figure 2.1 In the last decade and a half, positive terms of trade changes have increased incomes 
Gross Domestic Product, Gross Domestic Income and the Balance of Trade

Figure 2.1 In the last decade and a half positive terms of trade changes have increased incomes

Source: New Zealand Productivity Commission calculations, based on Stats NZ National Disposable Income Account. Notes: Chain-volume series expressed in March year 2009/2010 prices (NZD billions).

GDP = Gross Domestic Product.

GDI = Gross Domestic Income = GDP + trading gain or loss.

Trading gain or loss = the divergence between growth in production and income due to changes in the terms of trade (the relative prices of imports and exports).

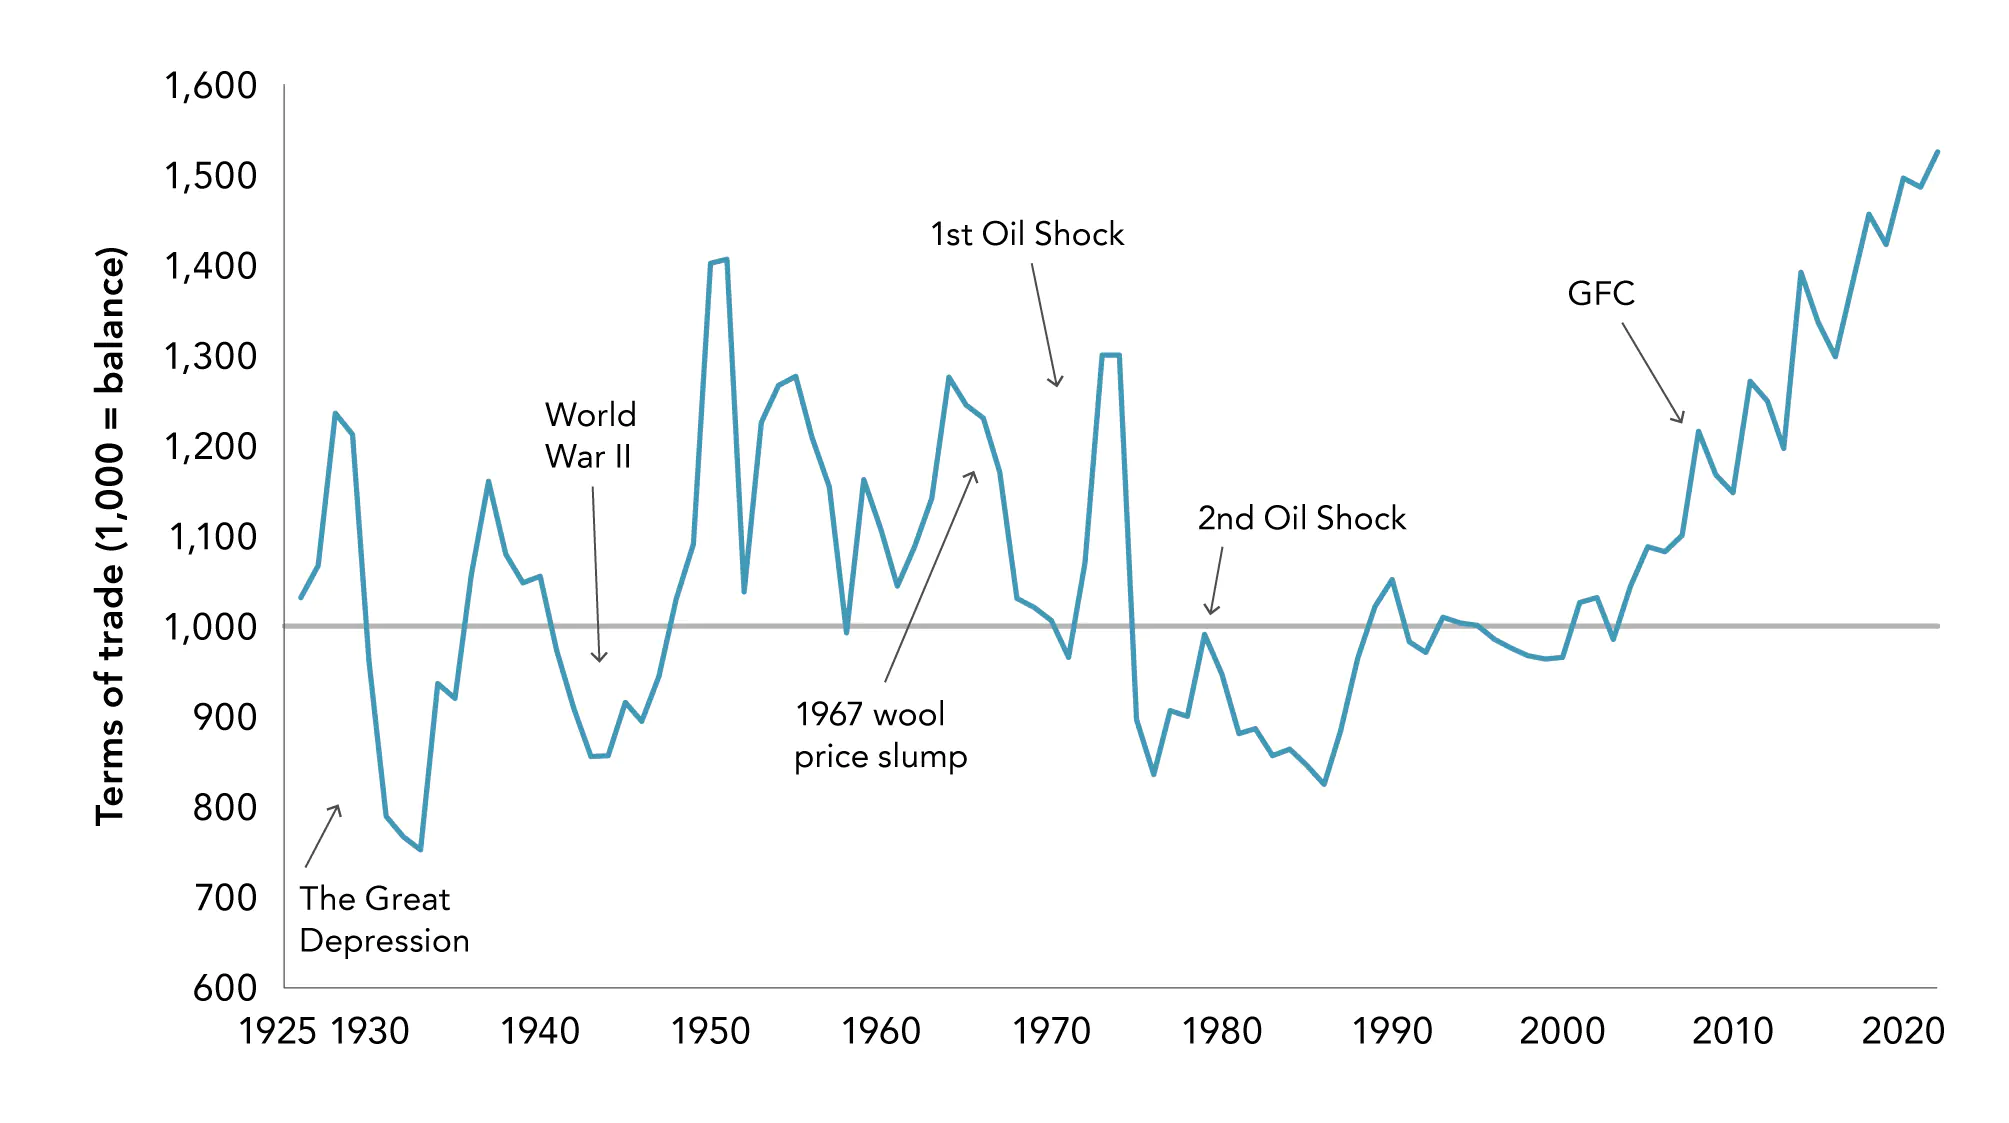
Welcome as such changes are, they are often outside a country’s control – particularly for a small country, like Aotearoa New Zealand, with large exposure to commodity markets. Their impact may just be blind luck, or it may be the result of reallocation of economic activity to areas where returns are higher, as can be seen in the shifts in land use from sheep and beef to dairy farming (Grimes & Wu, 2022). However, higher export prices might also be possible through sales teams accessing markets where consumers are willing to pay more. Lower prices might result from a cheaper source of imported intermediate inputs being discovered. A consideration of the history of New Zealand’s terms of trade (Figure 2.2) shows that the experience of the last decade is unprecedented. For most of the last century, New Zealand’s terms of trade have shown little or no trend, often returning to balance and even turning negative on occasion. Rather, they were marked by high volatility, which has driven some major structural changes in the economy and society. Since the turn of the century, the terms of trade have continued on a steady upward trend to levels not seen before.

Aotearoa New Zealand’s small size and exposure to competitive international markets makes its citizens vulnerable to changes in international prices. Positive terms of trade can increase the income of exporters and reduce costs for importers and consumers. However, such improvements may not be good for everyone. Although consumers benefit from lower import prices, some domestic workers may be worse off if the increased foreign competition causes them to lose their jobs and they are unable to find new jobs of a similar quality. Such changes are a risk faced by small trading nations. These shifts can be mitigated, or even turned into new opportunities, if entrepreneurs and firms can respond effectively to them.

Figure 2.2 Aotearoa's terms of trade
Terms of trade (all countries), merchandise imports and exports (June 2002 = 1000)

Figure 2.2 Aotearoa New Zealands terms of trade

Source: New Zealand Productivity Commission calculations, based on Stats NZ International Trade Statistics.

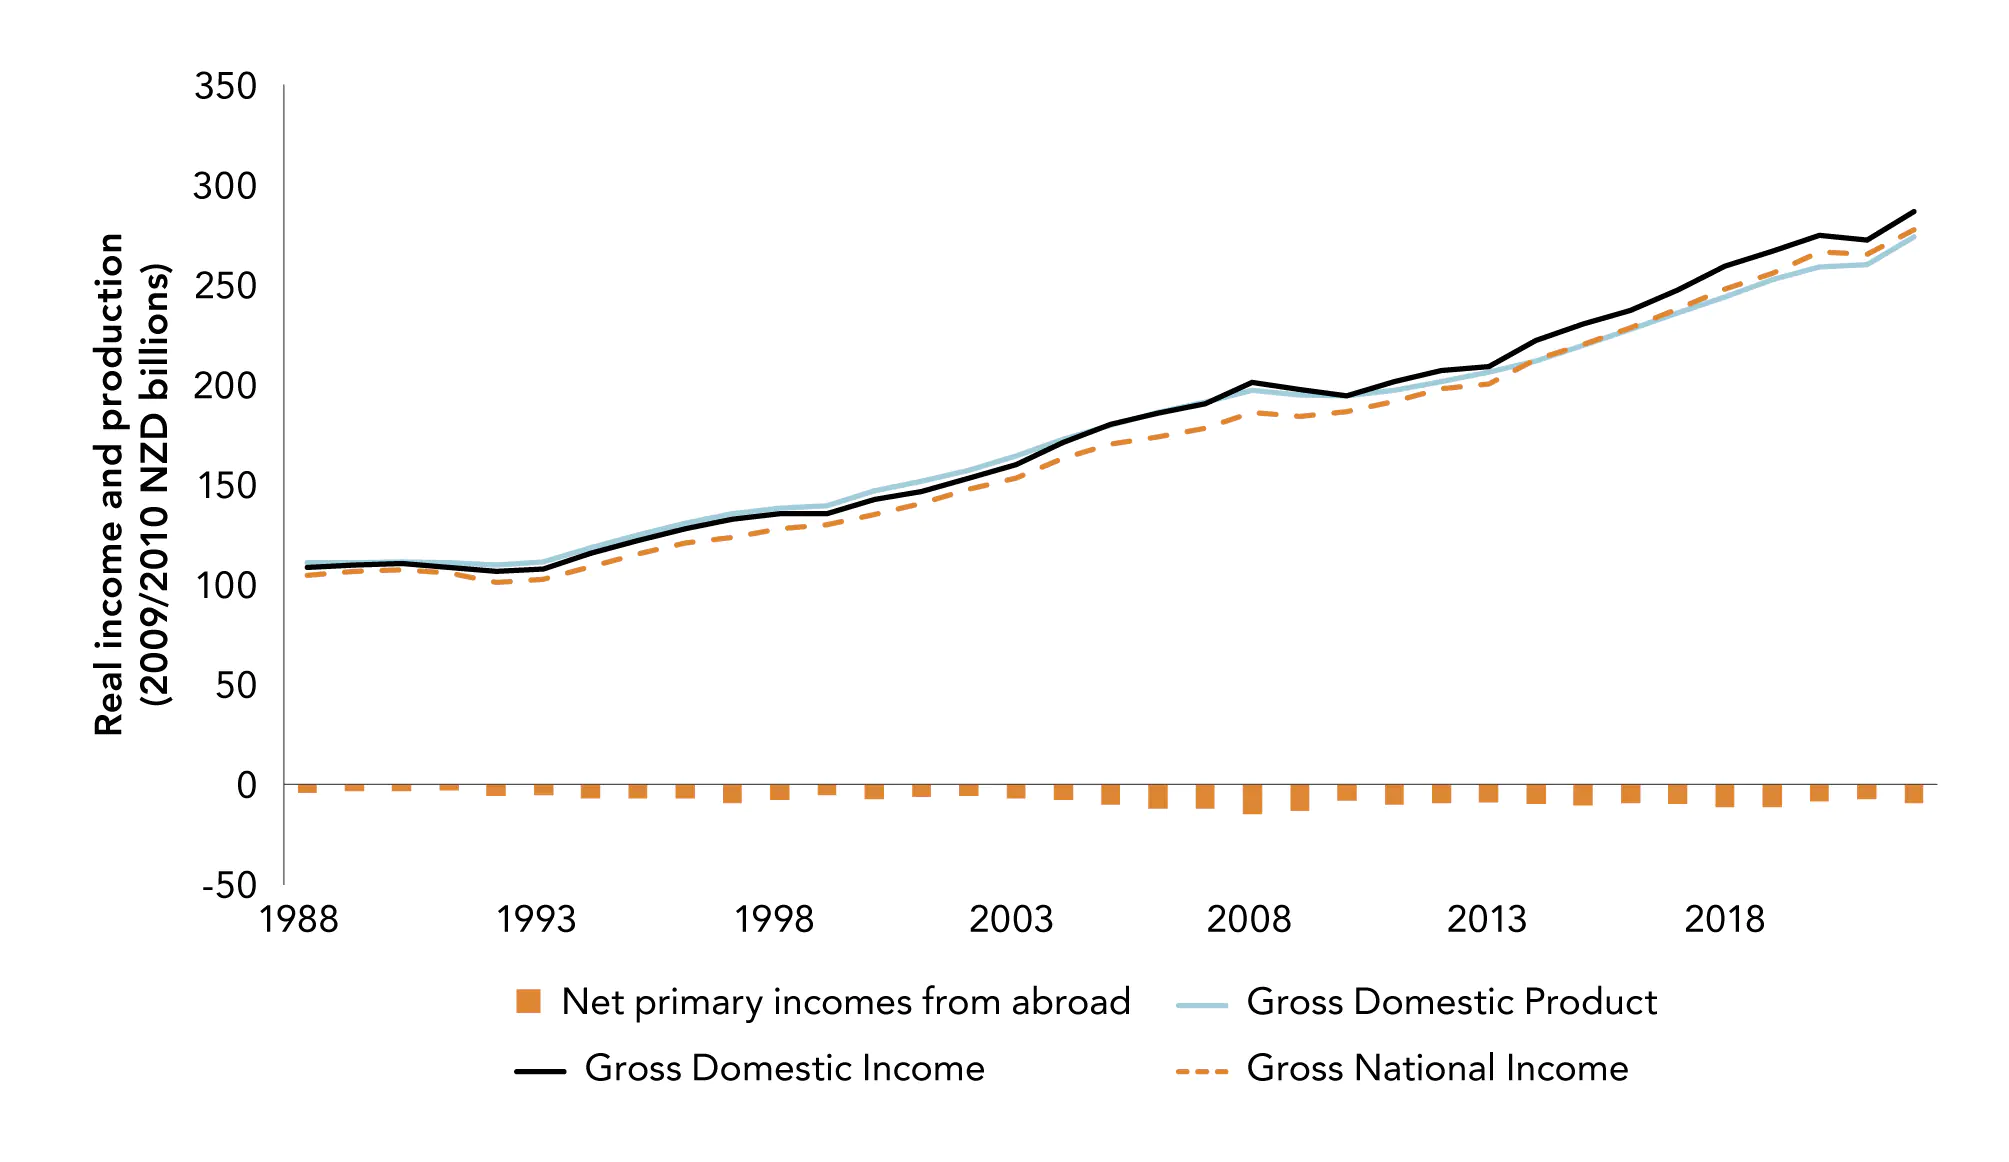
A related question is who receives the incomes generated from production. Some of the income generated by Aotearoa New Zealand production flows out to foreign investors. Likewise, New Zealand investors also receive income from abroad. “Net incomes from abroad” refers to the recorded difference between income flows to domestic residents from production that occurs abroad and outflows of income from domestic production to non-residents. It includes distributed income from corporations, as well as dividends. If we add this to gross domestic income, we obtain the total income flowing to New Zealand residents (or Gross National Income (GNI)). When we compare GNI to GDI, we see that there has been a net outflow of income from New Zealand for the past 30 years (Figure 2.3). While the terms of trade have improved the income available for consumption (that is, material wellbeing) in recent years, this has been cancelled out by the increase in income going overseas.

Figure 2.3 Some of the income gains have flowed abroad
GDP, GDI, GNI and the flow of incomes, 1988–2022

Figure 2.3 Some of the income gains have flowed abroad

Source: New Zealand Productivity Commission calculations, based on Stats NZ National Accounts. Notes: Chain-volume series expressed in 2009/2010 prices (NZD billions).

GDP = Gross Domestic Product.

GDI = Gross Domestic Income = GDP + trading gain or loss.

GNI = Gross National Income = GDI + net primary incomes from abroad.

Net primary incomes from abroad = inflows of income attributable to overseas production which accrues to Aotearoa New Zealand residents – outflow of income attributable to production occurring domestically accruing to non-residents.

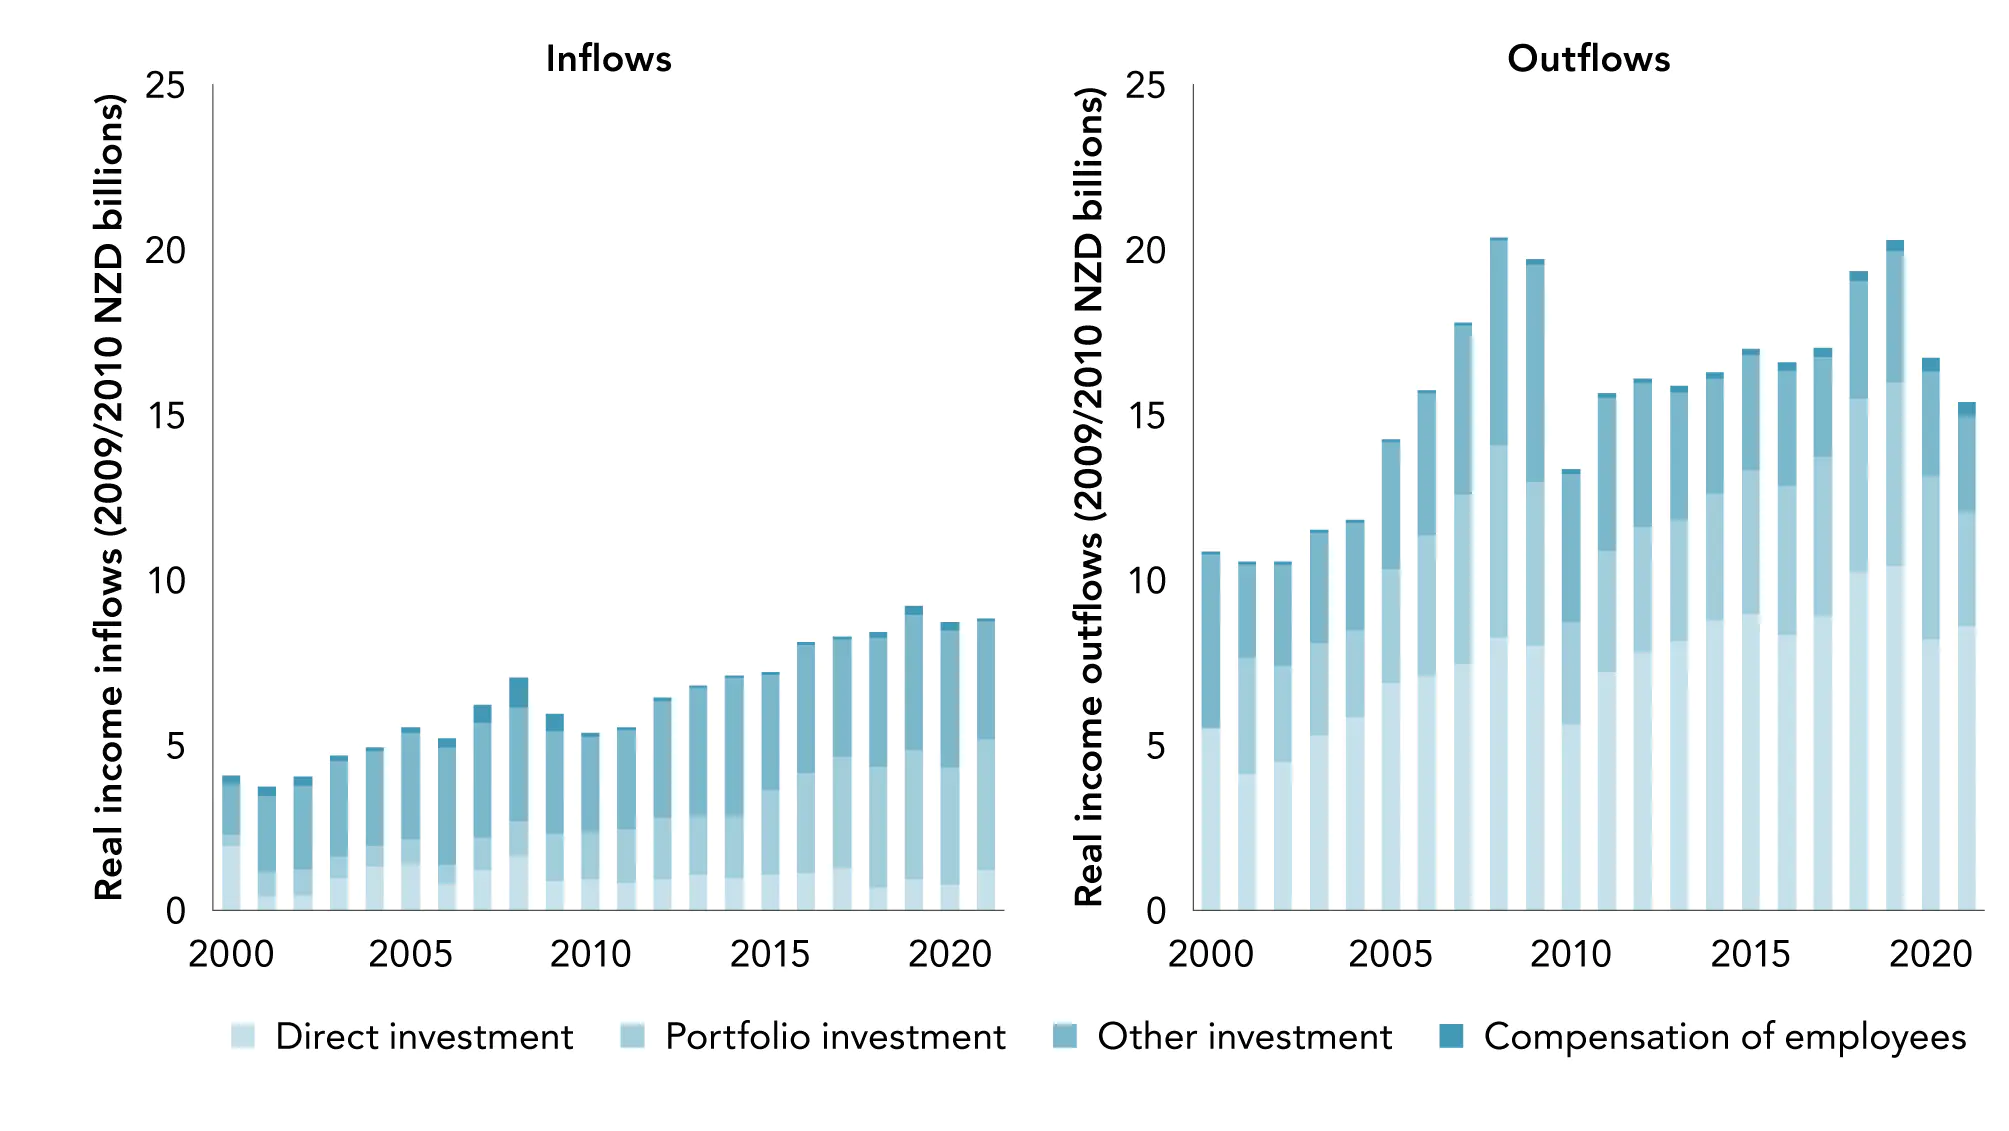
The big difference between the income flowing into Aotearoa New Zealand and the income flowing out is due to income flows from direct investment (Figure 2.4). Direct investment is where a single investor owns 10% or more of voting shares in a company. Portfolio investment is when an investor owns less than 10% of the voting shares of a company, or when an investor holds debt securities issued by a company in which the investor’s ownership interest is less than 10%. Borrowing and lending in the form of debt securities between related depository corporations are also included under portfolio investment. The largest growth in international income for New Zealand over the past 20 years has come from portfolio investment.

Where the other components of net primary income inflows and outflows are more similar, there is a much larger amount of direct investment income flowing out of the country. A major part of these outflows are returns on equity (dividends and distributed branch profits, and return on reinvested earnings), rather than interest payments. This imbalance reflects the lower stock of outward foreign direct investment (FDI) by Aotearoa New Zealand firms (see section 4.3 below), as well as lower returns to our outward investment compared to foreign investment into the country (OECD, 2017a).

Figure 2.4 A large portion of primary income flows are direct income
The composition of flows of primary income

Figure 2.4 A large portion of primary income flows are direct income

Source: New Zealand Productivity Commission analysis of Stats NZ Balance of Payments data.

Notes:  Direct investment is a situation where a single investor owns 10% or more of voting shares in a company.

Portfolio investment is when an investor owns less than 10% of the voting shares of, or debt securities by, a company. It also includes borrowing and lending in the form debt securities.

Other investment comprises borrowing and lending using loans, trade finance and deposits (<10% ownership interest).

Compensation of employees comprises wages/salaries earned from providing labour.

Depreciation and income

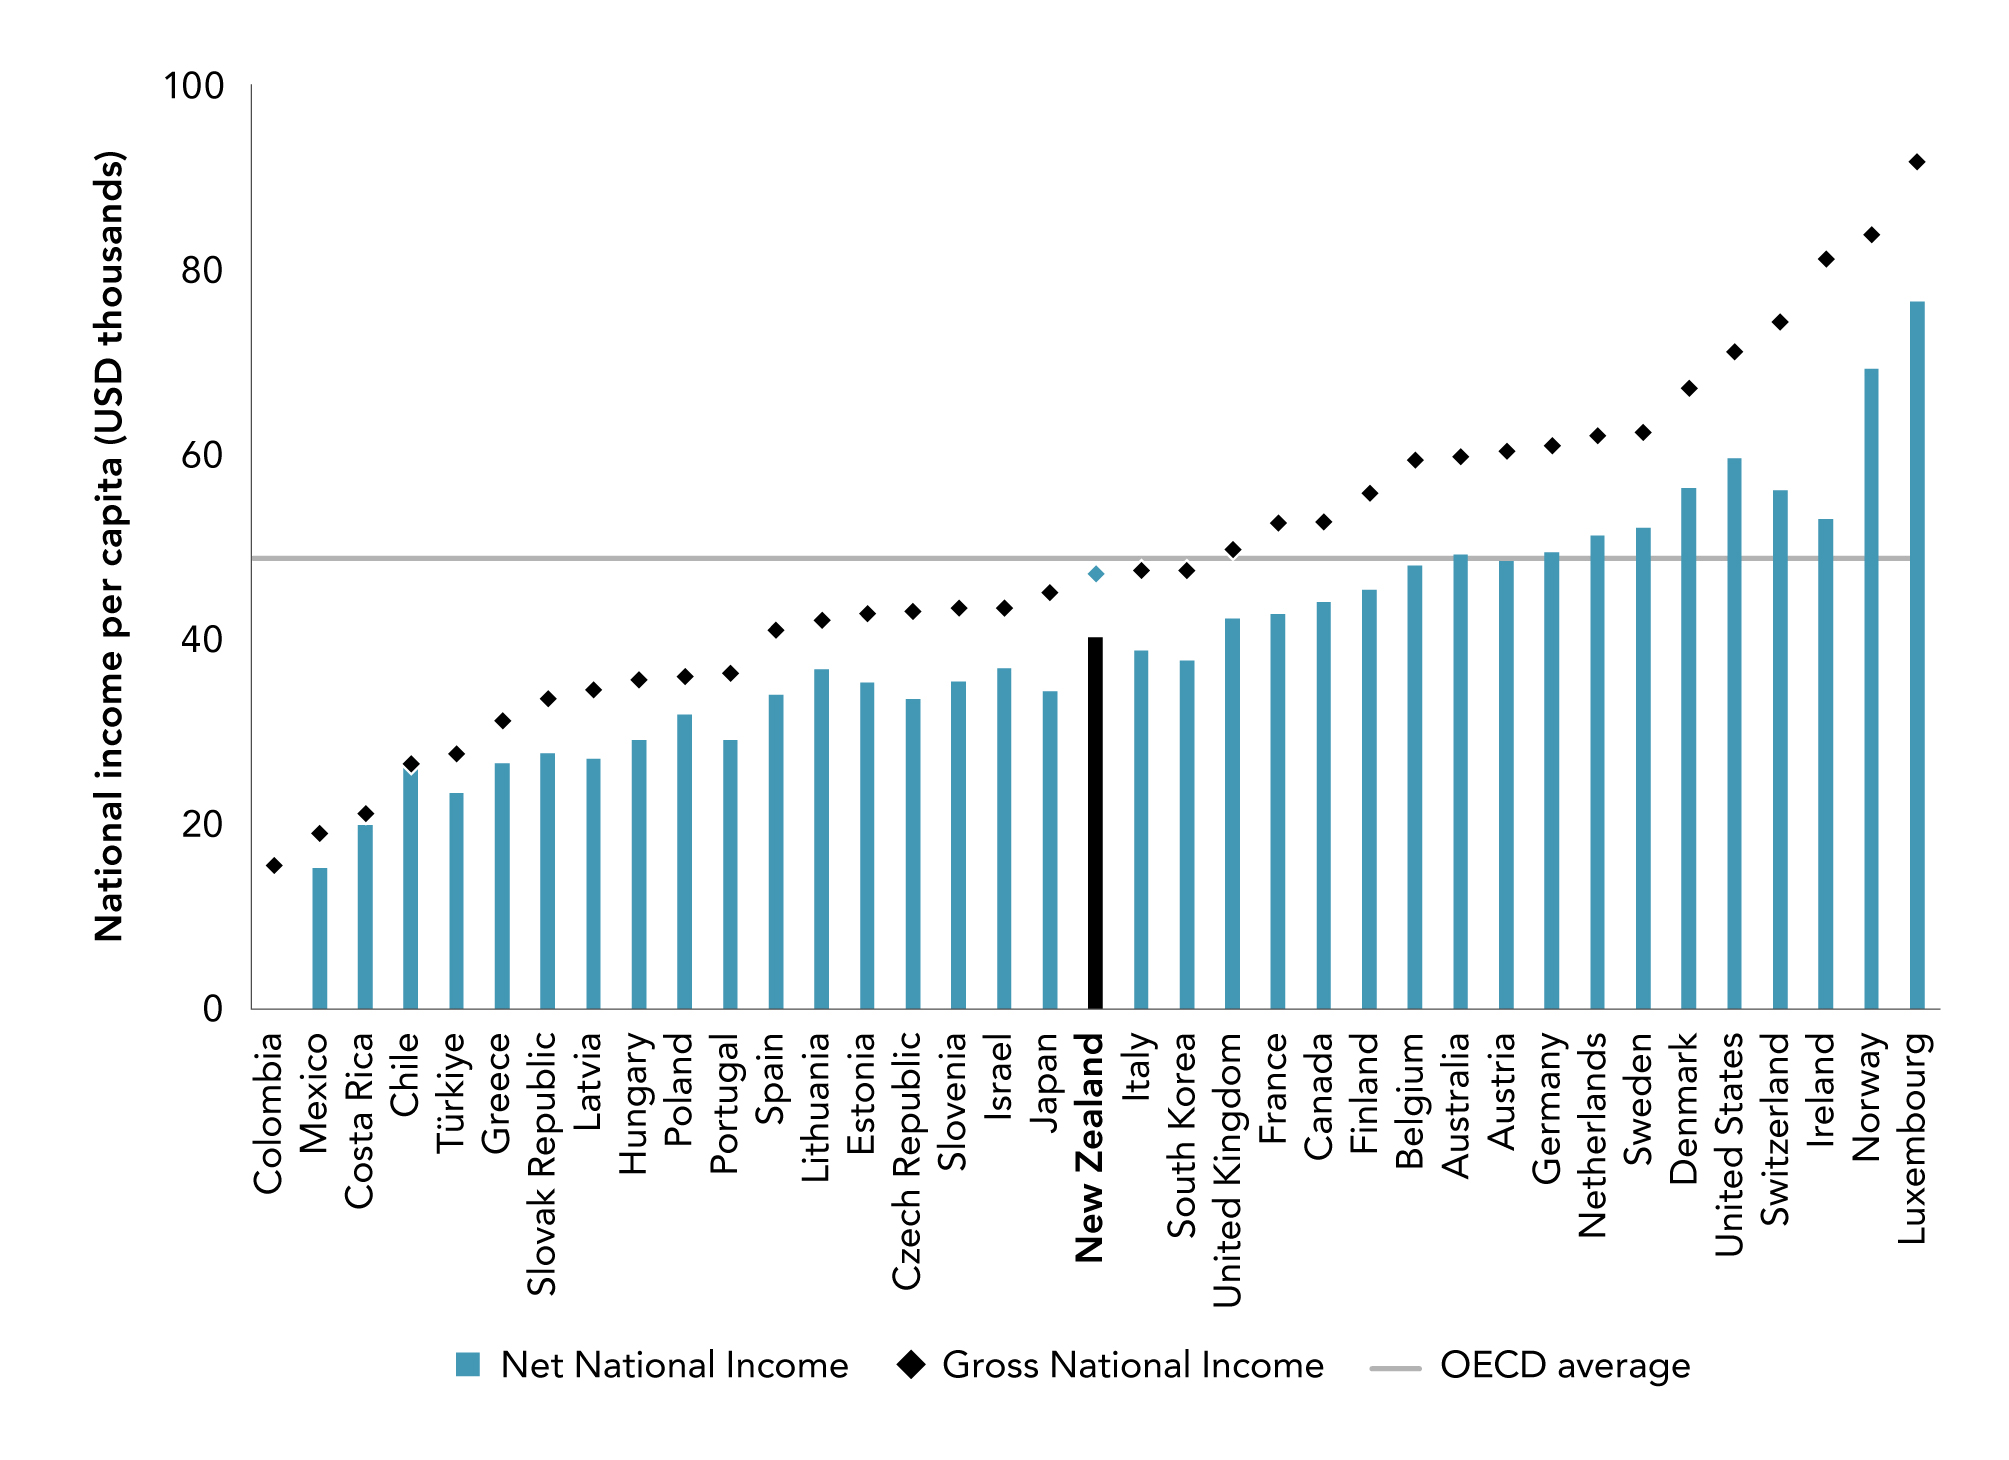
Some of the income received by Aotearoa New Zealand needs to be reinvested to maintain our productive capacity.6 Net National Income (NNI) removes the value of depreciation of fixed assets from GNI to measure the income that New Zealanders have available to spend without decreasing our productive capacity in the future.7 New Zealand looks a little better than South Korea and Italy (countries with a higher gross national income) in terms of NNI (Figure 2.5), because it needs to pay less to maintain its productive capacity.

Figure 2.5 Gross vs Net National Income per capita, 2021

Figure 2.5 Gross vs Net National Income per capita 2021

Source: New Zealand Productivity Commission calculations, based on OECD National Accounts Statistics.

Notes:  Net National Income = Gross National Income less depreciation.

Figures are in current USD.

Figures are for 2021, except Colombia (2020) and Türkiye (2017).

2.2 Production, productivity, and material living standards

Economists have long emphasised that national product or income is not the same as wellbeing (for example, Kuznets, 1934). Box 2 provides a brief history of GDP. Understanding productivity, income growth, and their contribution to wellbeing is an important area of research, and there have been conceptual and methodological advances in recent years (for example, Asian Productivity Organization and OECD, 2021). As we noted in section 1.1 above, Treasury has developed a Living Standards Framework (LSF) for assessing the impacts of policy on wellbeing, based around how the broadly stated wealth of Aotearoa New Zealand and our institutions and governance relate to individual and collective wellbeing. Similarly, He Ara Waiora is a mātauranga Māori framing of wellbeing.

  Box 2 A brief history of GDP - from war to cooperation 

The history of GDP is a history of war, disasters, and taxation.

The grandfather of national accounting, William Petty, grew up in a time of turmoil: the English Civil War, wars with Holland and France, plague, and famine. Petty was also born into a time when empiricism was also taking its first, tentative steps. He had been involved with possibly the first statistics publication, by his friend John Graunt (Graunt, 1676), which used mortality tables to create what has been described as the first “comprehensive picture of social and economic conditions” (Lepenies & Gaines, 2016, p. 13).

For Petty, the task was to work out how much the British people could be taxed to support war with Holland and France. In an empirical counterpart to Adam Smith’s economic theory a century later, Petty believed – and showed – that Britain’s economic performance, including the value created by labour, was greater than suggested by traditional measures based on land ownership. He argued the growth of Britain was due to improvements in infrastructure, agricultural progress, and trade – not merely the acquisition of more land.

Similarly, in the 20th century, when national accounting emerged in earnest, its two parents were similarly focused. In the United States, Simon Kuznets was asked by the government to calculate the capacity of the US economy to produce material required to enter the war with Japan and Germany. The gross national product “statistically demonstrated the transformation achieved by the American economy and the military successes” of Roosevelt’s “Victory Programme” to bring “opponents to their knees by producing massive amounts of armaments” (Lepenies & Gaines, 2016, p. 123). This work built on earlier work Kuznets had done as part of a battle against another national crisis, the Great Depression, when the government had cried out for a picture of the national economy. Across the Atlantic, James Meade and Richard Stone answered the call from John Maynard Keynes, down the corridor at HM Treasury, for better data on taxable income as a source of war finance. Keynes had written his grand opus – The General Theory of Employment, Interest and Money – in a response to Britain’s own Great Depression (Keynes, 1936).

The Western Allies’ recovery plan from what became the Second World War included the founding of the Organisation for European Economic Cooperation (OEEC). As well as administering the Marshall Plan aid, and delivering the European Recovery Programme, the OEEC also produced the first Standardised System of National Accounts. This formed the basis of the United Nations System of National Accounts. Later, the OEEC evolved into the Organisation for Economic Cooperation and Development (OECD). Many of our international comparisons in this report are based on OECD data.


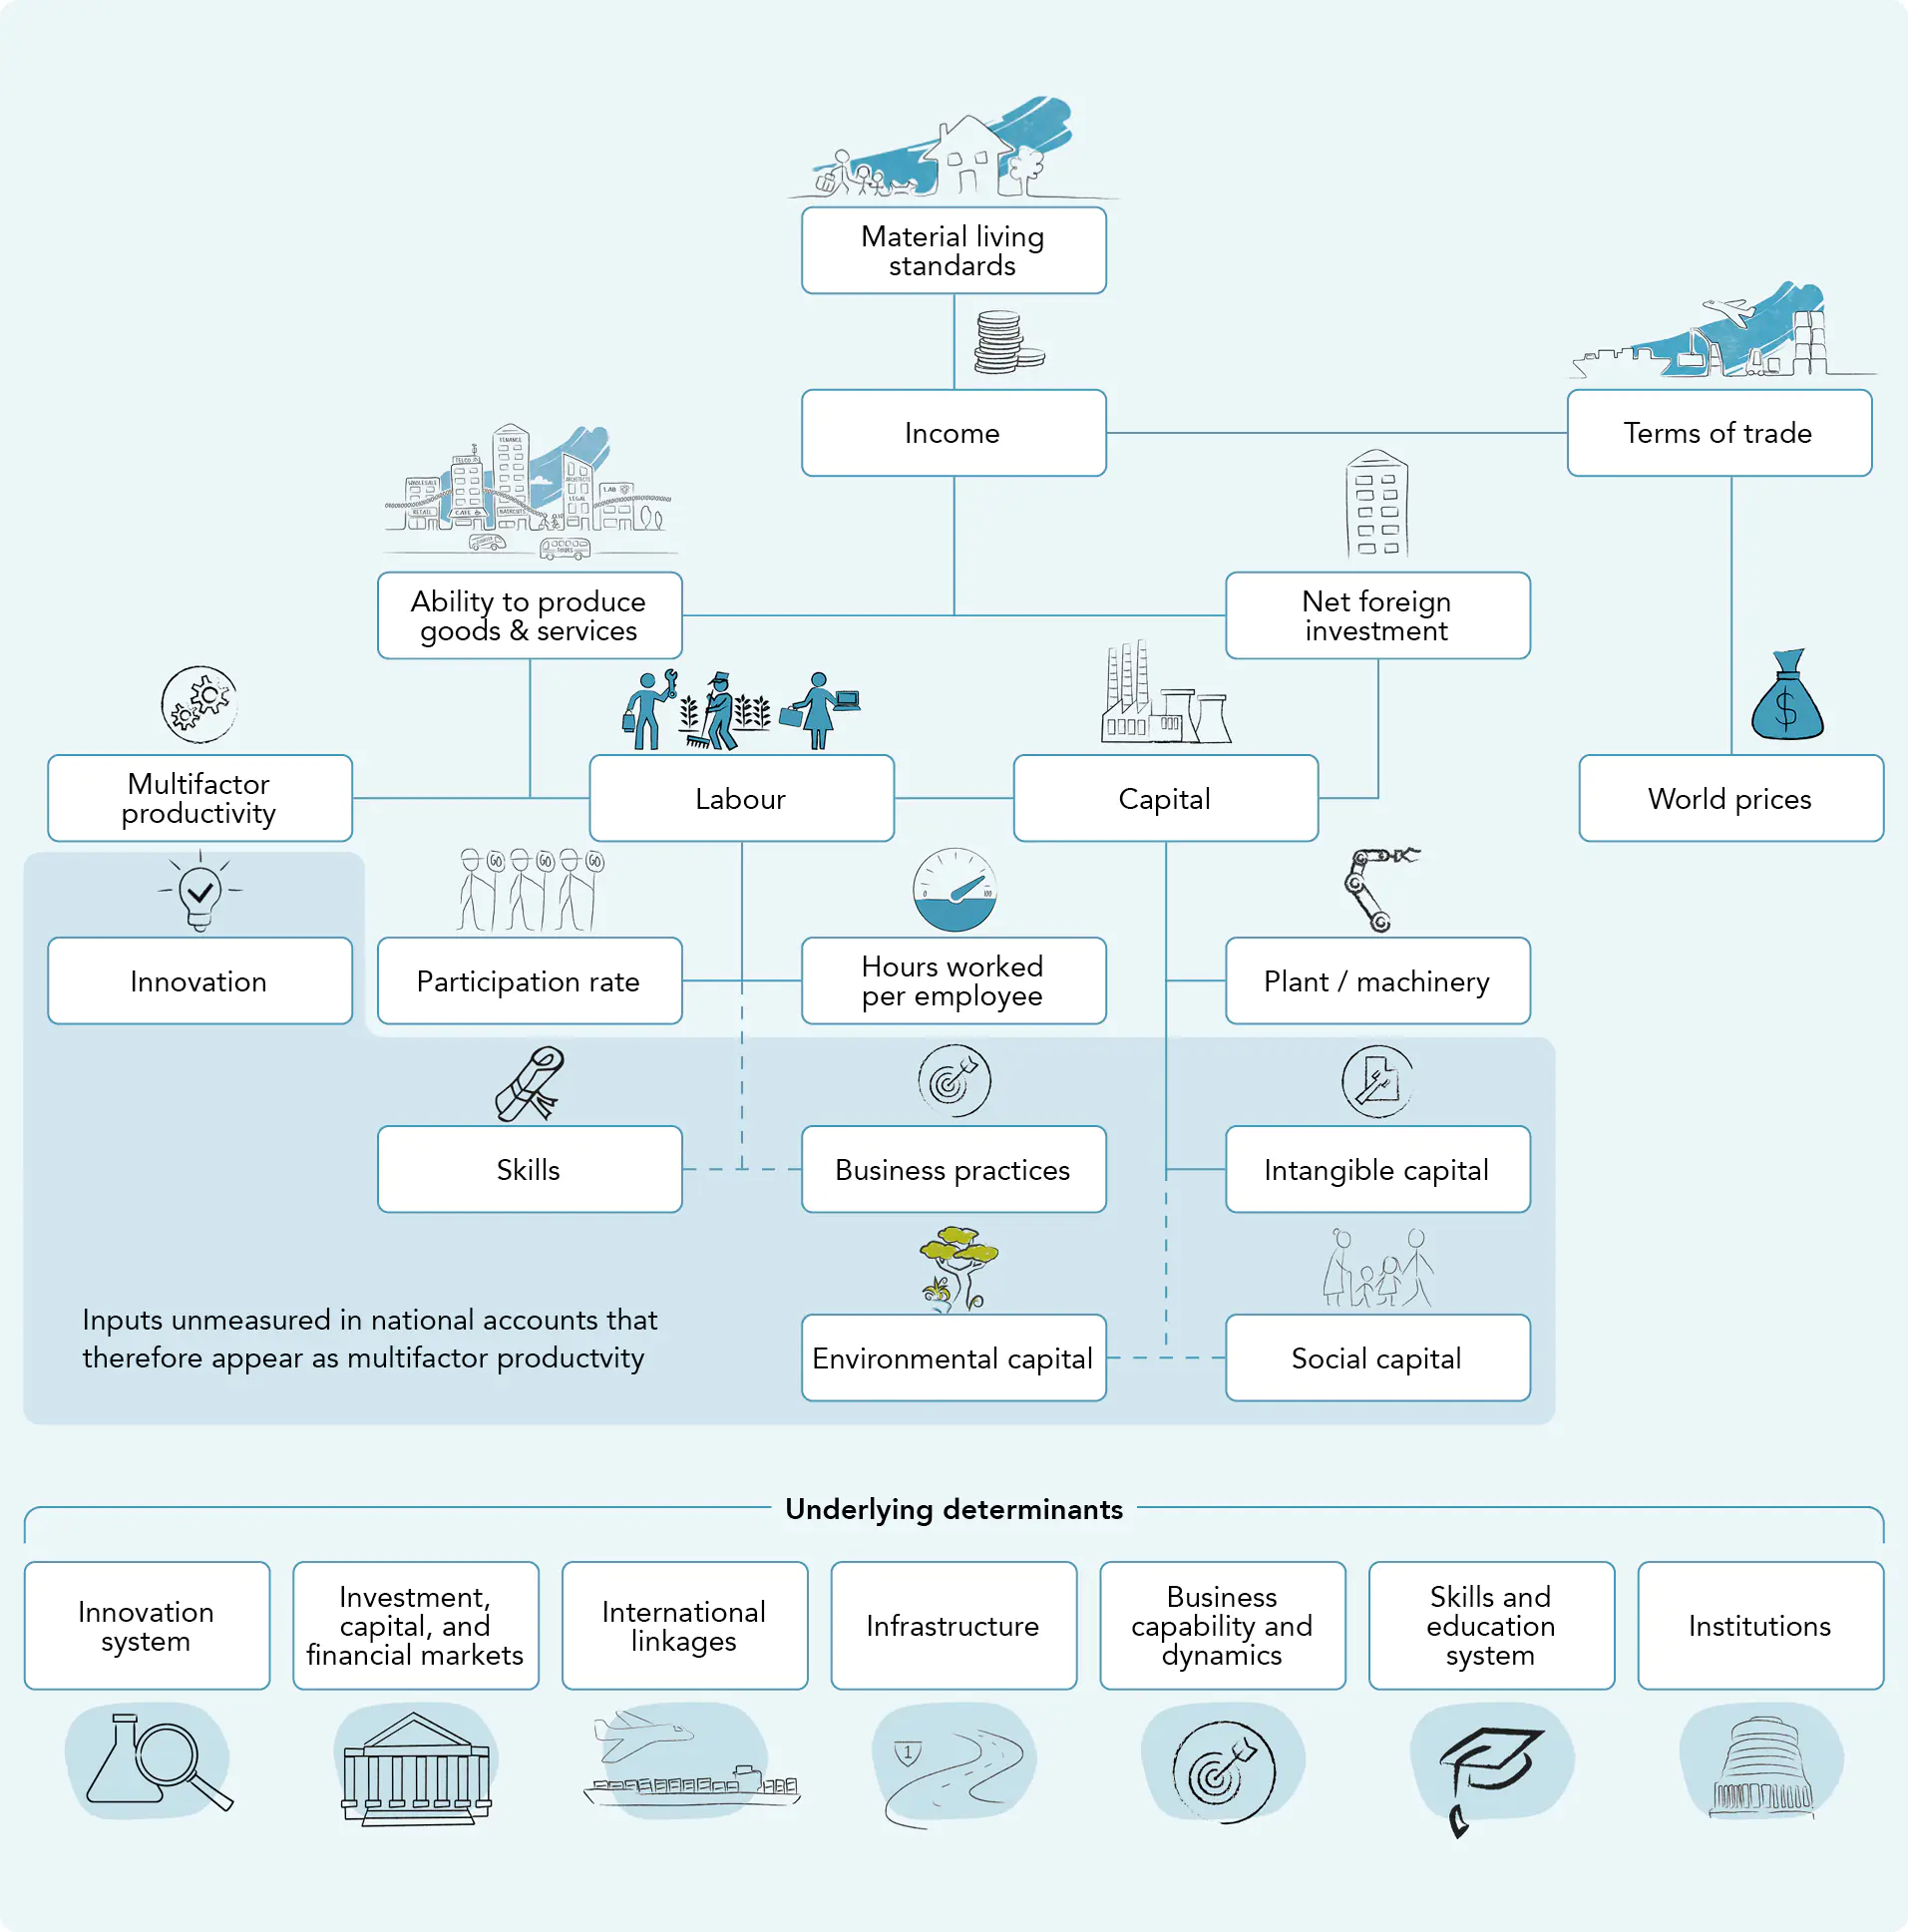
Although wellbeing is a much broader concept than income or material living standards, our ability to produce and purchase the goods and services that we want, and need, remains a critical ingredient to overall wellbeing. Figure 2.6 is a stylised representation of how material living standards are primarily determined by a country’s ability to efficiently produce goods and services – both for domestic consumption and export to other countries. The role of world prices, terms of trade, and net foreign investment has been touched on above. In the remainder of this chapter, we discuss the factors underlying our ability to produce goods and services, with a focus on the methods and challenges for measuring productivity. In Part 3, we use these standard measures to describe Aotearoa New Zealand’s productivity performance in comparison to other countries and over time.

Figure 2.6 The drivers of material living standards

Figure 2.6 The drivers of material living standards

Goods and services are usually the most tangible and easily identified outputs from production. In the accounting framework used to measure national productivity, three factors determine how much output an economy can produce:

  • the amount of labour;
  • the amount of capital; and
  • how well labour and capital are combined

Finding better ways of combining capital and labour to increase output is captured by multifactor productivity (MFP).8

Labour

A key determinant of a country’s ability to produce goods and services, and therefore attain higher material living standards, is labour (work). The degree to which labour produces goods and services is called labour productivity. Incomes can grow when:

  • people already in employment work more (that is, put in more hours);
  • people who have been unemployed gain paid work;
  • people outside of the workforce gain paid work (that is, increases in the participation rate); or
  • the volume of total goods and services sold increases faster than hours

Only the last point above is labour productivity growth. Over the longer term, the value of labour input can increase as the skills of the workforce increase. When labour productivity is measured using volumes of undifferentiated labour, such as in number of employees or hours, those increases appear as productivity growth (see Box 3 for more details on how labour input can be measured). As labour quality is hard to measure, national accounting practices focus on the quantity of labour employed.9 Therefore, productivity changes described in Part 3 will include changes in the skills of the workforce.

There are only so many hours in the day that people can work, and long working hours can contribute to stress and other harm. People also value things other than work, such as leisure and spending time with family.

Growing material living standards by increasing working hours has its limits.

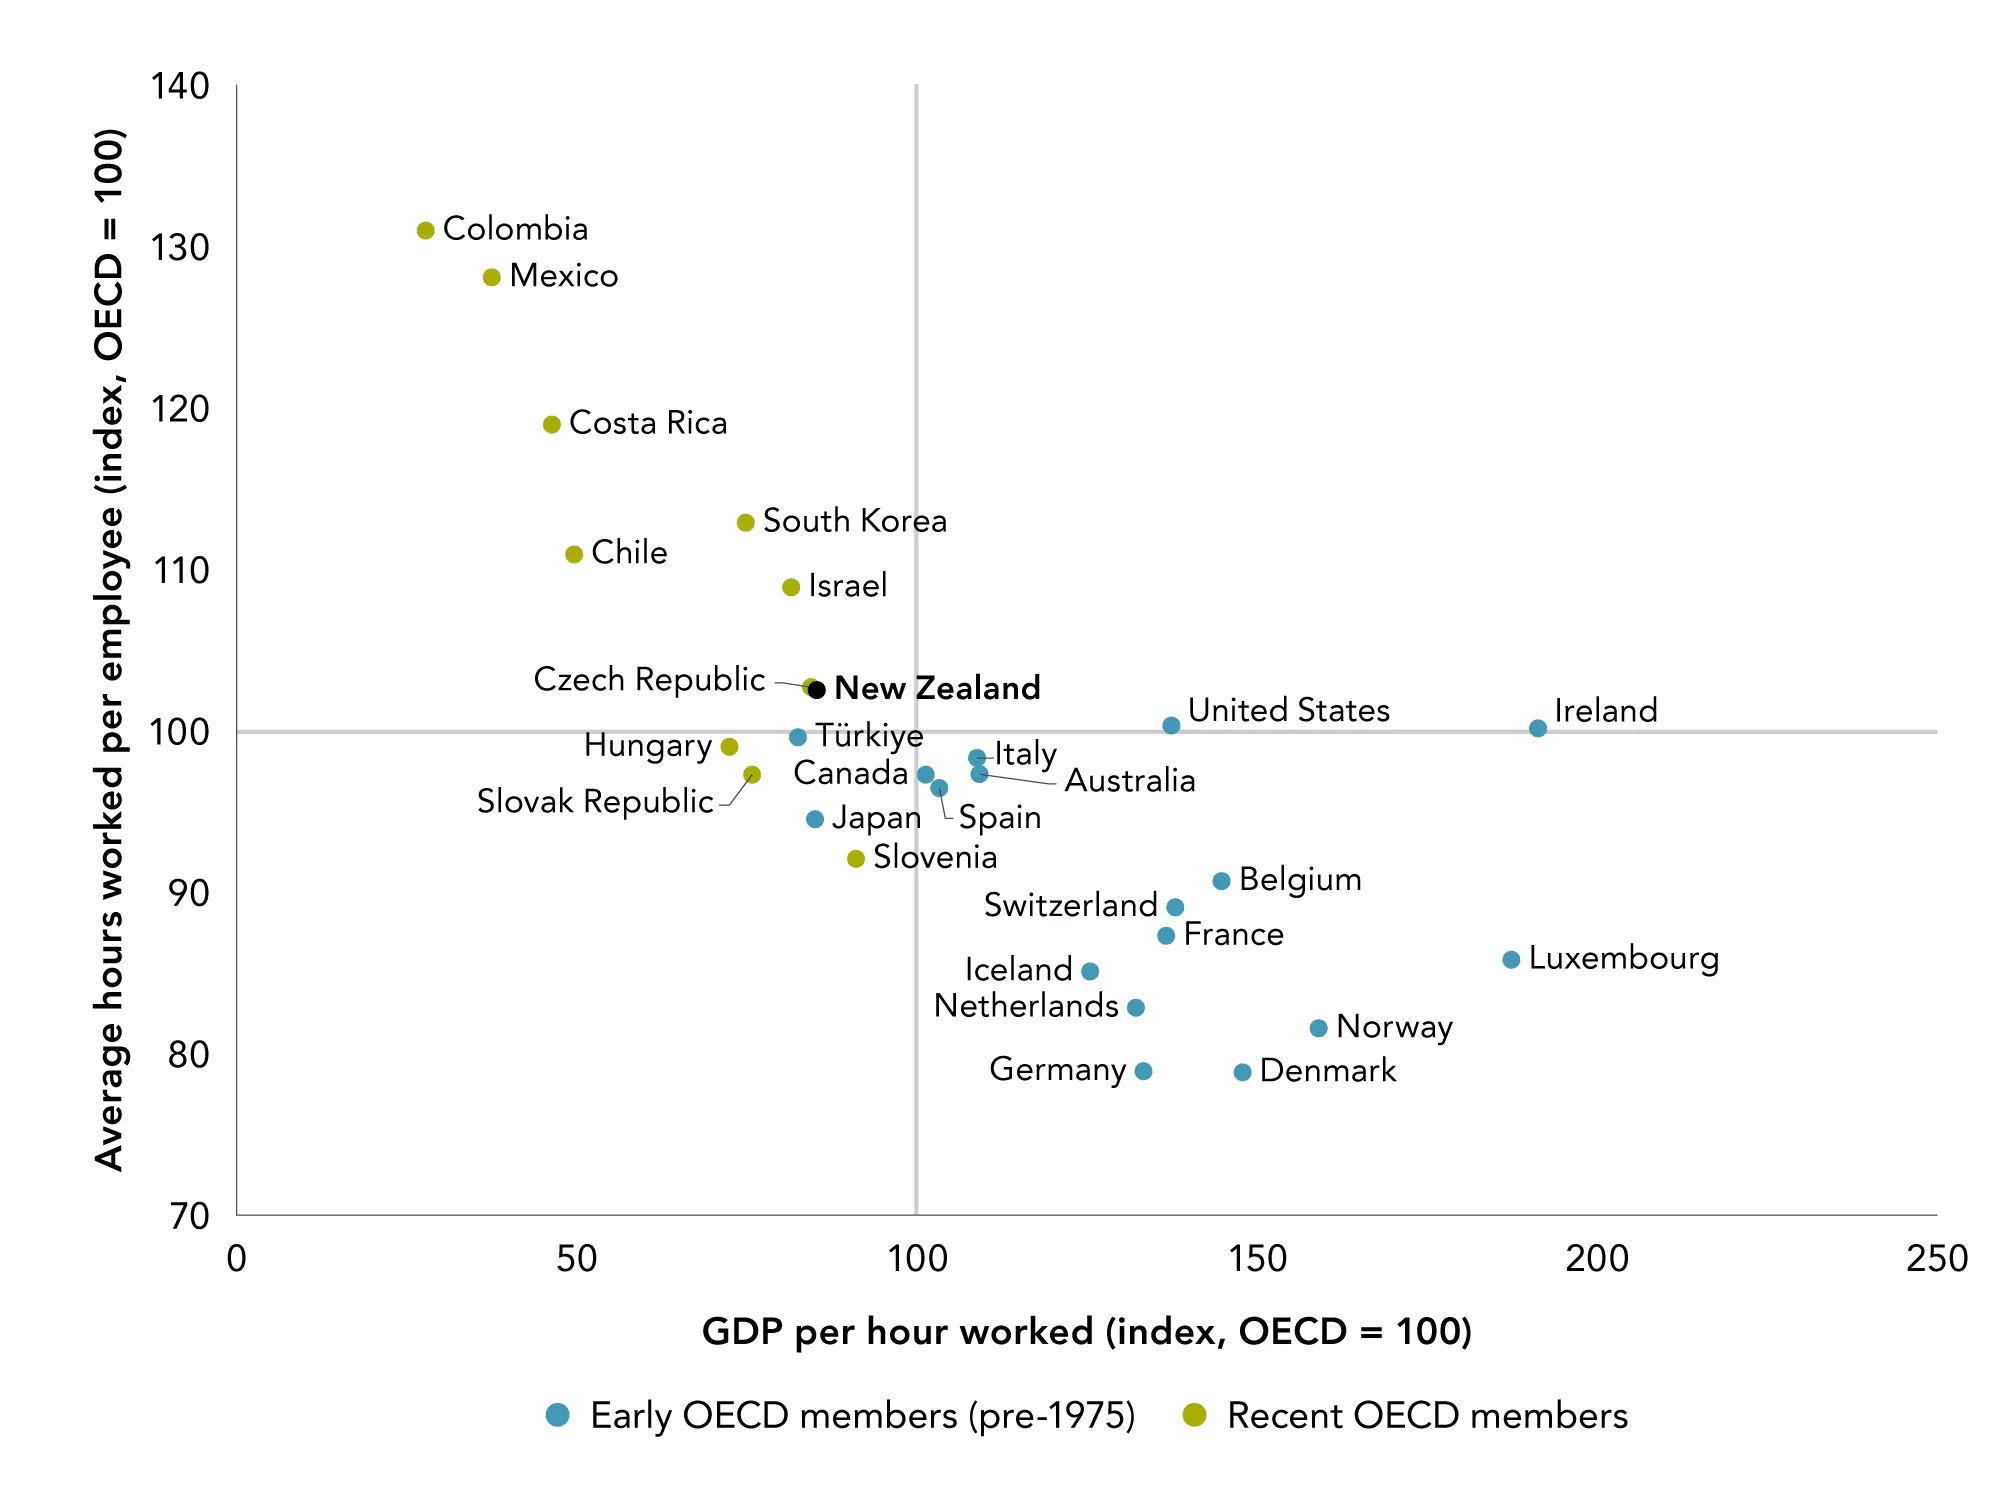
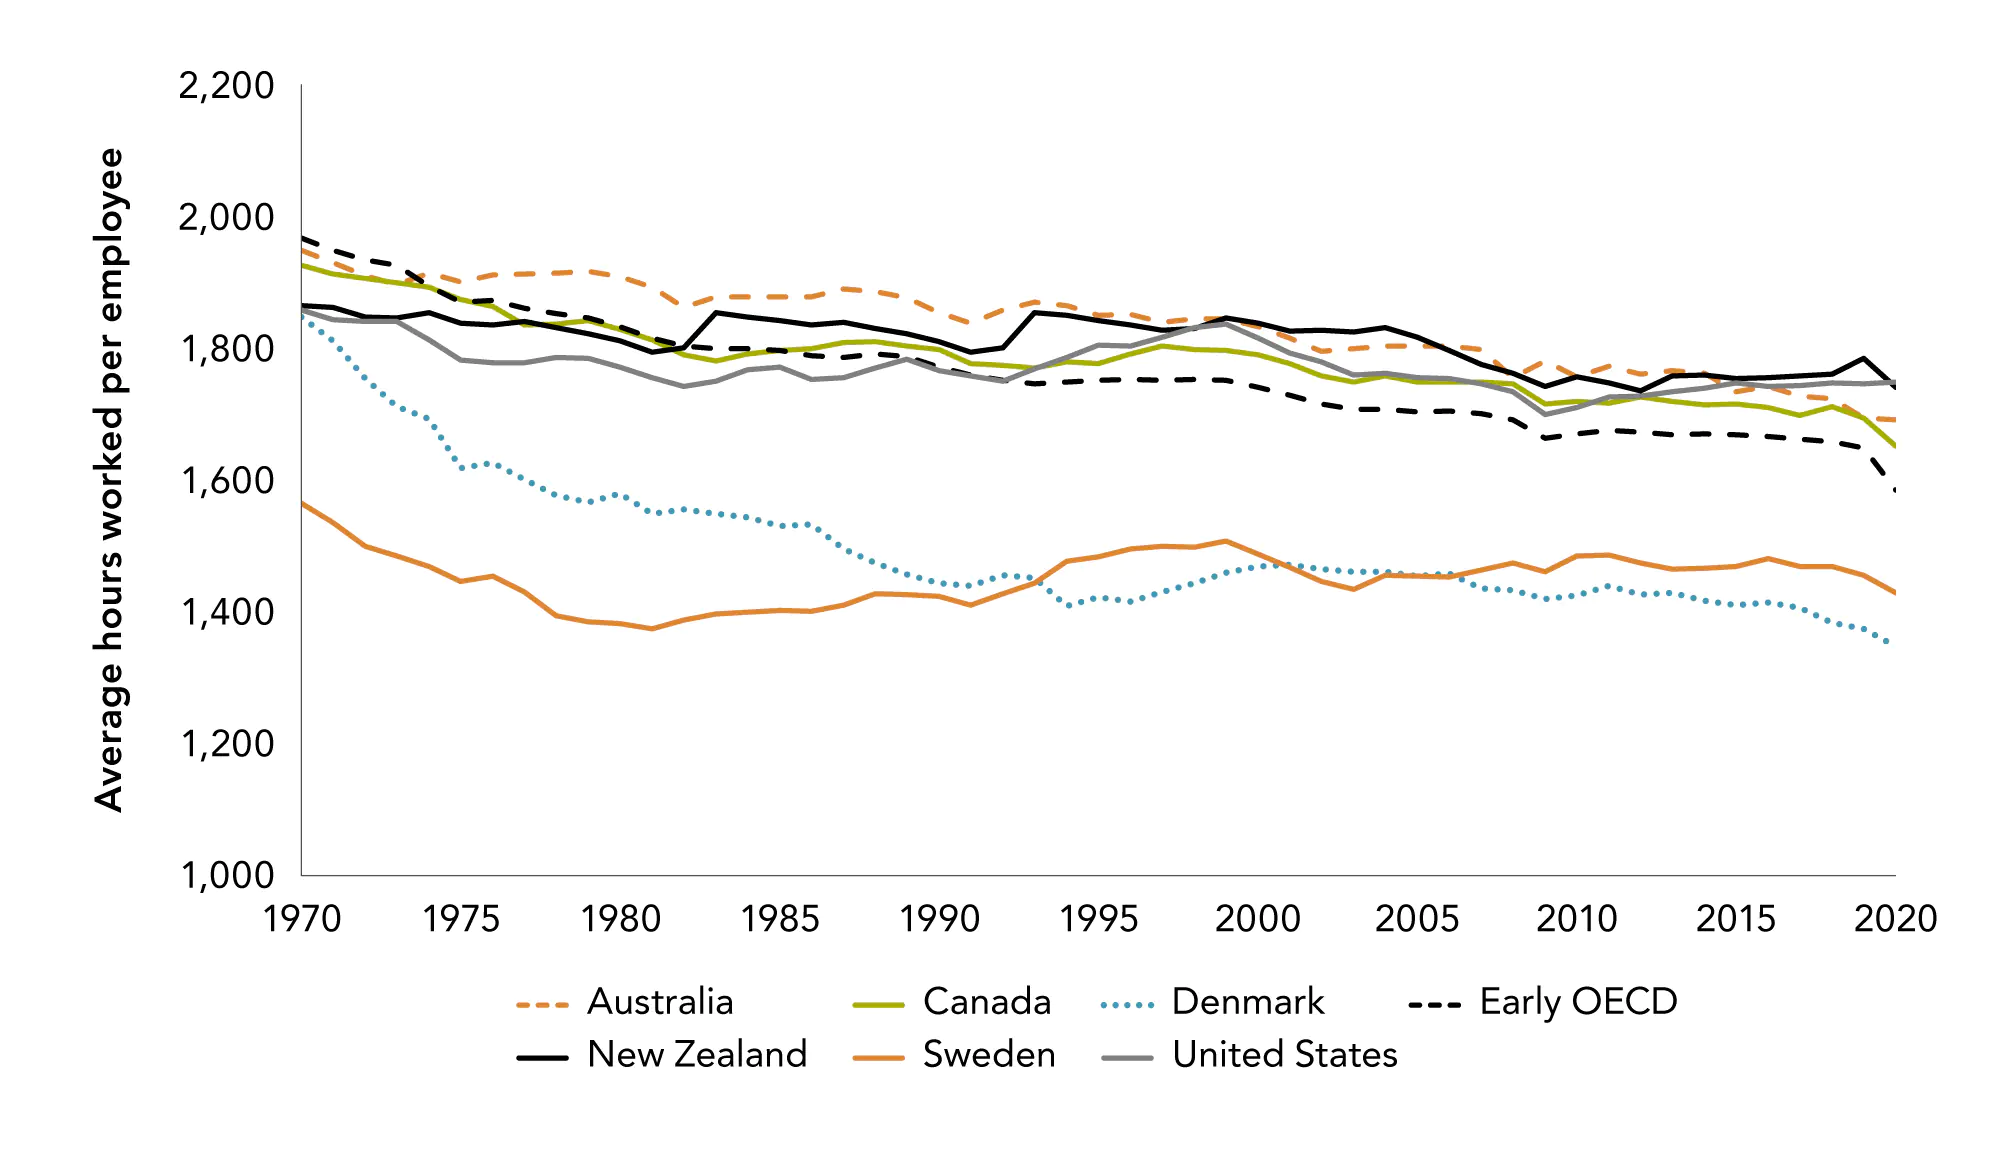
Figure 2.7 compares Aotearoa New Zealand with other OECD countries, showing that New Zealanders work more hours but achieve less output per hour than in many typical comparator countries. This is despite the expansion of the OECD to include many less-developed countries with lower incomes and more working hours than earlier member countries.

Box 3 Measuring labour input

An ideal measure of labour input is the actual labour services provided, which will depend on the amount of labour that is supplied, the intensity with which the labour is delivered, and the skills of the worker.

The most basic measure of labour input is the number of employees. This has the benefit of being simple to measure but gives only a rough indication of the amount of labour used. The number of employees can vary over the year, as in seasonal work in agriculture or tourism, and not all workers work full time.

Another common measure is hours worked, which accounts for variation across workers and across time to provide a more precise measure of the volume of labour input. Hours over which labour input is supplied can be difficult to measure. Often it is easier to measure which hours are contracted, or hours paid. But hours can vary (for example, because of overtime, sick leave, national holidays and vacations). Typically, these are measured using nationally representative labour force surveys.

Another distinction is between actual hours and usual hours worked. Ideally, we would be able to see all the hours actually worked by all workers. However, events like sick days, overtime and holidays are not only rare events, but they may also reduce the likelihood of a worker being surveyed. Many countries’ statistical agencies base statistics on usual hours worked and ask respondents to take these variations into account.

Recent research has questioned the actual hours measure (Janssen et al., 2022; Ward et al., 2018). This assumes that survey respondents are not accurate when reporting their hours worked, failing to account for variations such as annual and sick leave. Recent research by the Productivity Commission (Fabling, forthcoming) examined the case against using the current aggregate hours-worked labour series in Aotearoa New Zealand. Fabling found that the current series behaved sensibly when statutory minimum annual leave provisions changed. At the worker level, linked employer–employee data imply leave accrual is a substantial issue for alternative approaches that rely on assumptions about leave. Fabling’s findings support the ongoing use of self-reported hours worked in New Zealand – particularly during events like the COVID-19 pandemic, when it may be hard to justify a constant macro-adjustment approach.

Because their adjustment essentially replaces once presumed bias with another, and there is no clear evidence, Figure 2.7 excludes countries for which the “simplified component” method has been applied. This means that we are comparing data produced in the same manner.

At the firm level, we can also measure labour inputs using administrative data. Full-time equivalent (FTE) employment calculates the amount of labour relative to a “normal” working week. This can be based on hours, or a part-time vs full-time split. Rolling mean employment (RME) accounts for variation in employment over the period studied (typically the calendar or financial year). In the Integrated Data Infrastructure and Longitudinal Business Database, for example, the number of employees at each firm is captured through monthly and payday PAYE tax returns.

Some analyses make a quality adjustment of labour inputs, to account for the different skills of workers (for example, Maré et al., 2017). Accounting for labour quality is usually done in a national accounting context by weighting headcounts or hours worked of different skills (typically by qualification) by their relative wages (for example, Mason & Osborne, 2007).

Figure 2.7 New Zealanders work longer hours and get less output per hour than most OECD countries
Hours worked per year vs output per hour relative to the OECD average, 2019

Figure 2.7 New Zealanders work longer hours and get less output per hour than most OECD countries

Source: OECD Productivity Database.

Notes: Figures are relative to the OECD average. GDP per hour worked (index, OECD = 100) estimated for Australia. Average hours worked per person employed (index, OECD = 100) estimated for Australia. Excludes countries for which the OECD applies the simplified component method for hours worked (Ward et al., 2018).

Capital

In the measurement of productivity, “capital” refers to physical and intangible assets – the equipment and structures that are used in the production of goods and services. Examples include computers, machinery, vehicles, software, and buildings. These assets provide firms with a flow of services over time, rather than being used up in the production process. Conceptually, capital also includes elements such as institutional, social, environmental and knowledge capital. These are more difficult to measure, but developments have been made in these areas (see Box 5). National accounts separate produced capital (like machinery and buildings) from non-produced capital (like land), which is not produced by human investments (except in some specific examples). Land is treated as an asset in the national accounts, and it includes the ground (including the soil covering it and any associated surface waters) and major improvements that cannot be physically separated from the land itself. It excludes any buildings or other structures situated on it or running through it, which appear as produced capital.

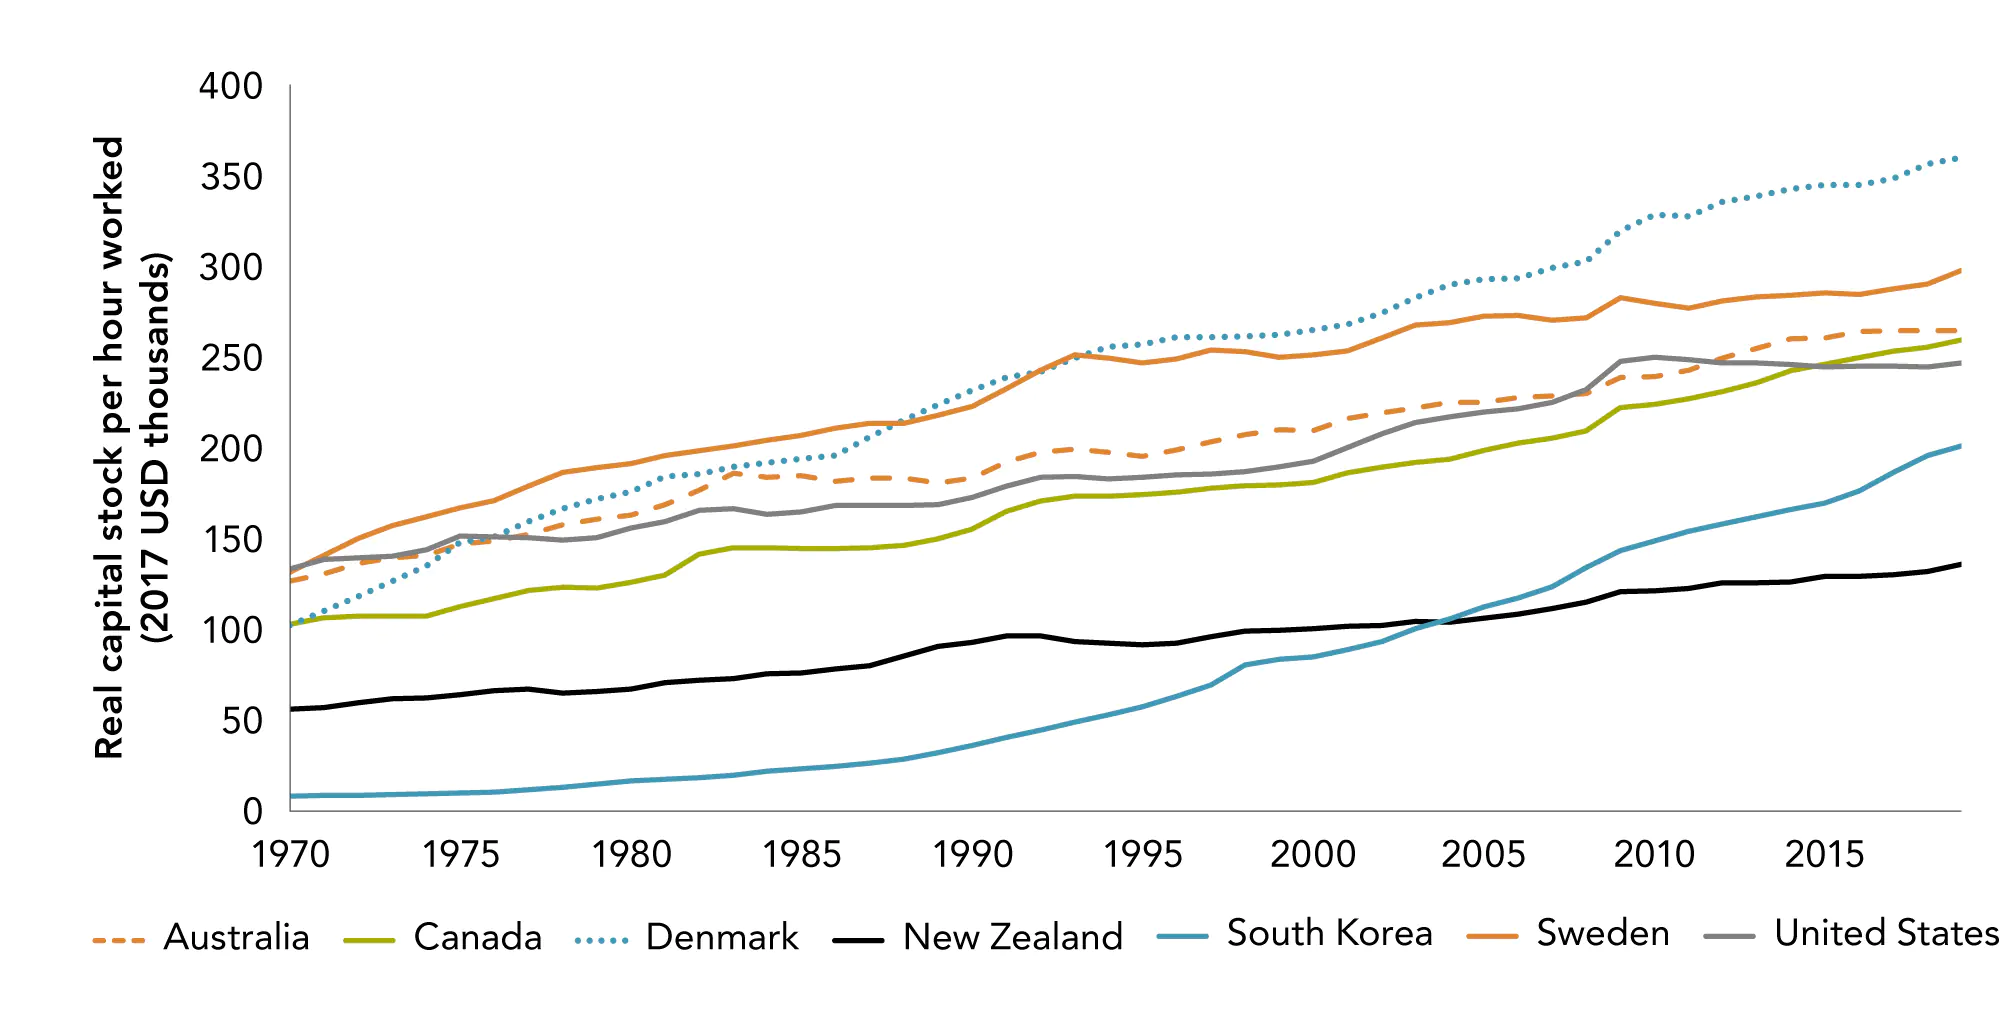
Introducing new capital can increase the relative volume or value of output by replacing labour, reduce the costs of production, make workers more productive, or allow new goods and services to be created (NZPC, 2020b). Aotearoa New Zealand firms are, by the standards of other developed countries, capital shallow, meaning workers have relatively limited equipment to work with (NZPC, 2020a). The accumulation of more and better capital equipment per worker over time is known as “capital deepening”. Using domestic savings and international borrowing to invest in productive capital assets makes workers more productive, increasing labour productivity.

Although labour and capital are treated as separate inputs to producing goods and services in Figure 2.6, they do not operate in isolation. For example, the availability of labour can affect the decisions made by firms on whether to invest in capital. In areas where labour is scarce or otherwise very costly, firms may invest more heavily in technology to meet their production goals. One example is in Japan, where an ageing population, declining workforce, and limited inflows of migrants have created strong incentives for firms to automate (Schneider et al., 2018).

Multifactor productivity

In addition to increasing the supply of capital and labour, firms can improve how their workers make use of their skills, equipment, and other inputs. This is captured as MFP, which measures the overall efficiency with which all the measured inputs combine to produce the measured outputs.

When all inputs in the production process are measured and accounted for, MFP growth can be interpreted as the amount of growth in real output that is not explained by the growth in inputs.

The residual – the part that is not explained by growth in inputs – has been described as a “measure of our ignorance” (Abramovitz, 1956), because many of the inputs in the production process are difficult to measure. As technology advances, this is likely to increase, at least while national accounting standards catch up.

Although increases in MFP are commonly referred to as “technical change” or improvements in efficiency, there are many possible sources of MFP growth. They are more accurately interpreted as some combination of technological progress, efficiency gain, unobserved change in capacity utilisation, and measurement error (see Appendix for more detail). These components are considered in the following sections of this chapter and in more detail in the introduction to Part 4.

MFP is most useful as a measure of productivity growth over a whole economic (or “growth”) cycle, as annual movements in measured MFP can be volatile and do not necessarily represent true changes to underlying productive capacity.10 When estimating MFP growth, capital utilisation is usually assumed to remain constant, but when there is a sudden drop in demand, firms may choose not to sell capital rather than to use it less. Particularly relevant for Aotearoa New Zealand is variation in the weather, which can affect primary production volumes and the utilisation of processing capacity. Stats NZ has made specific adjustments to its assumptions about capital utilisation over the period of the COVID-19 pandemic, which is discussed in section 3.4 below.

The long-run drivers of MFP stem from using technology and skills in new and innovative ways. Innovation is an inherently risky long-run game. Being entrepreneurial and making continual investments to maintain, improve and adapt skills, equipment and technology are key to improving performance and national productivity. Firms that are successful in the long term have learned lessons in many ways: from business schools as well as the school of hard knocks, from previous experiences of success (and failure), by observation, and through trial and error. For example, we found in our New Zealand Firms: Reaching for the frontier inquiry (NZPC, 2020a) that kaupapa Māori firms and enterprises adopting long-term intergenerational perspectives can offer lessons for other firms looking to maximise lasting value. Some of these lessons are discussed in Box 10 of Part 5.

Considering these factors, MFP measures should only be used for longer-term productivity analysis. We must also be careful when making cross-country comparisons using MFP, as quite strict assumptions need to be made.11 Consequently, most studies across countries use labour productivity as the metric for comparison.

2.3 Recognising the limitations of standard productivity measures

Productivity measures are a powerful tool for investigating the nature and sources of growth in material living standards. However, there are limitations to be considered, especially when using these measures to inform policy.

What is in and what is out often depends on what can be easily measured

Stats NZ’s productivity statistics cover the “measured sector”, which comprises predominantly market industries. The measured sector covers approximately 80% of Aotearoa New Zealand’s GDP and cuts across the three main sectors of the economy (that is, primary, goods-producing and services).12

In Aotearoa New Zealand, the quantity of labour for businesses is measured by hours paid, not hours worked, so our productivity measures exclude unpaid household, community and voluntary work – all of which can contribute to individual, family, and social wellbeing (Waring & Steinem, 1988). Measuring these activities requires gathering information about how people spend their time (rather than their money), which is information last collected by Stats NZ in 2010. This is a gap in measurement, and it is important to acknowledge that although a large proportion of material living standards result from market exchange, a large proportion also results from household production and community enterprise.

Official productivity statistics also exclude most public services or measure them in different ways than services provided by the market are measured. Collective goods and services, such as population or sub-population public health initiatives, are especially hard to measure. Where public services are free or only nominally charged, measurement would underestimate their value to recipients.

Many government services are not captured by official productivity measures.

National accounts have traditionally valued public sector outputs at the cost of their production, such that productivity growth will appear as zero, by definition, for many government services.

There have been several attempts in Aotearoa New Zealand and overseas to improve the measurement of public services and their productivity. In 2010, Stats NZ published a feasibility study for measuring publicly provided health and education sector productivity in New Zealand and concluded it was feasible to estimate productivity performance over time in a similar manner to that in the measured sector. We present long-term trends in New Zealand’s health and education sector productivity in Part 3.

It is important to adjust for changes in the quality of services provided

The education and health productivity measures published by Stats NZ are significant improvements over past practice, but they do not capture all changes in the quality of public services. Stats NZ numbers simply measure changes in the volume of outputs: cost-weighted equivalent full-time students for education, and cost-weighted inpatient and day-patient hospital events for healthcare. They can show the influence of production shifting from lower- to higher-value output if the weights account for differences in quality,13 but they do not show whether schools have become more effective at teaching, or whether hospitals are better at healing people.

Quality adjustment therefore matters for providing a more complete picture of public sector productivity. There are techniques available for adjusting public sector productivity data to reflect changes in the quality of services. Several case studies were explored in our Improving state sector productivity inquiry (NZPC, 2018a). In the case of the education sector, Gemmell et al., (2017) tested a range of quality adjustments to productivity estimates for Aotearoa New Zealand’s schools, based on sector-level data. They found that the most reliable adjustments provided a broadly consistent picture of flat or declining measured productivity in the school sector.

Adjusting for quality is also important to better understand productivity growth in market industries. For example, the current labour measures may not fully capture changes in skill levels within the workforce (that is, the “quality” of labour, or “human capital”). This will underestimate labour productivity growth, and over-report MFP growth, if the quality of the labour force is increasing. As noted above, there are techniques for adjusting market industry labour data to reflect changes in the skill composition of the workforce and therefore better identify how “quality” improvements have contributed to productivity growth (McNaughton, 2008).

Significant gaps in the measurement of inputs remain

There are also gaps measuring capital input. Official measures of capital focus on physical assets valued at market prices. However, estimating capital accumulation with market prices can miss spillovers and network effects from new capital investment. Intangible assets like knowledge, technology, ideas in development, reputation and brands are not all measured as capital and instead are captured within the MFP “residual” (see Box 4). They are identified, but they are conflated with other influences on MFP, making it difficult to understand the issues and design appropriate policy.

Box 4 Innovation, research and development, and intangible capital

Research and development (R&D), and other investments in innovative activity, create knowledge or intangible capital that can be used to produce output more efficiently. However, the inputs used to create this knowledge are often indistinguishable from the capital, intermediates and labour inputs directed towards current production. Therefore, inputs will be overstated during periods of heavy investment in intangibles (such as adapting business practices to accommodate new technologies), leading to apparent low productivity growth. As this new but unobserved intangible capital bears fruit, productivity growth will be overstated, as measured output increases (Brynjolfsson et al., 2019, 2021).

Corrado et al. (2022) calculated that current national accounting measures of intangibles pick up about two-thirds of total intangible investment (see Figure 2.8). Their calculations – using the EU KLEMS and INTANProd datasets14 – suggest that private investment in intangibles is around twice as high as private tangible investment in property, plant, and equipment (16.8% vs 8.5% of GDP). They also described the mechanisms where incorrect classification of inputs and outputs of intangibles bias our measures of productivity. As well as the direct effect, the non-rival nature of knowledge means it can disperse (or “spill over”),15 so around one-fifth of intangible capital translates into gains in multifactor productivity (in a similar way to measured R&D investments).

Figure 2.8 Intangible capital: Broad categories and types of investment

Figure 2.8 Intangible capital. Broad categories and types of investment

Source: Corrado et al. (2022)

Other factors that matter for productivity growth and wellbeing are either not directly measured or only partially captured in the MFP “residual”. These include social capital (such as levels of trust among citizens and the quality of our institutions) and natural capital (from which people draw the ecosystem services the environment provides). A risk of not explicitly incorporating these capitals is that degradation may go unnoticed and true economic growth and productivity will be overstated.

As part of its LSF work (discussed in section 1.1 above), Treasury includes aspects of factors such as cultural capability and belonging, the natural environment and environmental amenity in its dashboard of indicators (Hughes et al., 2022; The Treasury, 2022). Others have integrated them explicitly into their measures of productivity (Grimes & Wu, 2022).

For example, mismeasured economic growth achieved through environmental depletion reduces the total capital available for future years and the potential wellbeing of future generations. A recent review of the economics of biodiversity conducted for the UK Treasury illustrates this point starkly.

Estimates show that between 1992 and 2014, produced capital per person doubled, and human capital per person increased by about 13% globally; but the stock of natural capital per person declined by nearly 40%.

Professor Sir Partha Dasgupta, The economics of biodiversity, 2021, page 114

The Asian Productivity Organization (APO) and the OECD have noted that “an accurate estimation of output and input measures is key for the appropriate measurement of MFP” (2021, p. 83). They have recently recommended adding several environmental productivity indicators to official statistics sets (Box 5).

Box 5 Options for measuring environmental productivity
  • Energy productivity: “output generated (in terms of real GDP) per unit of total primary energy supply … expressed as USD per tonne of oil equivalent.”
  • Material resource productivity: “output (in terms of real GDP) generated per unit of non-energy materials (ie, excluding fossil fuel energy carriers) used.”
  • CO² productivity: “economic value generated (in terms of real GDP) per unit of CO² emitted, in terms of gross direct emissions from fossil fuel combustion.”
  • The APO and OECD also recommend the development of an environmentally adjusted MFP measure, in which natural assets are included as inputs, based on their annual extraction rates and unit extraction rents.
Source: Asian Productivity Organization & OECD (2021), pp. 106–111.


Challenges in measuring outputs

One manifestation of technological progress that has challenged the measurement of outputs is the digitalisation of goods and services.

  • The rise of internet streaming services has largely replaced the purchase of CDs, LPs and other physical music media (APC & NZPC, 2019).
  • High-quality cameras and photo-editing tools now come bundled with smartphones, rather than as separate products.
  • Online tools now allow “more and more households to provide services to themselves that used to be produced by private companies. For example, households are now able to use search engines and travel websites to book flights and plan holidays, while this would previously have required a dedicated travel agent” (APO & OECD, 2021, 22).
  • Rapid increases in computer processing and internet download speeds can make it difficult to measure the value of the services they provide over time (for example, a smartphone from 2015 is arguably not comparable to a smartphone which uses 5G technology in 2023).

Adjustments may therefore be needed on the output side to ensure productivity statistics reflect technological progress, which have changed the quality and nature of the goods and services over time to be more service-like. Baumol’s “cost disease” is the idea that the inability of some labour-intensive activities to substitute labour with technology (capital) would cause costs in such activities to rise over time, relative to other activities (Baumol, 1996). Baumol also argued that productivity growth is elusive in service industries, because services are poorly suited to standardisation and (by implication) to substitution by technology, and because their quality depends (or is thought to depend) on the amount of human labour they involve (Baumol, 1993).

Any potential improvements in digital goods and services will be challenging to measure because it is difficult to identify standardised outputs and prices. Each of these new industries will have unique problems, which in turn depend on how one measures intangibility, quality and interaction with inputs provided by consumers of the service.

Future directions for research and measurement are discussed in Part 5.

5 In this context, prices contain two components. One is important information about the relative value of current and new products and services. The other is merely a nominal one that needs to be removed in analyses such as this. We need to distinguish the changes that are due simply to a general increase in prices (that is, inflation) from changes that come from a substitution to more valuable goods and services, or the introduction of new or improved ones.

6 This is sometimes called “Hicksian income” because of the three measures of income set out by Hicks (1946, 173–174).

7 Currently, national accounts only accounts for certain types of produced capital, but it is feasible to extend this to include other assets that need to be maintained, such as the environment (Brekke, 1997; Grimes & Wu, 2022; Pearce & Atkinson, 1995).

8 This is sometimes called total factor productivity (TFP). However, since this implies that we have measured all the factors determining production and this is all that is left, we prefer the term multi-factor productivity, to distinguish it from single input measures such as labour productivity.

9 Stats NZ produces a “composition-adjusted” measure of labour, but it is not currently used in productivity estimates.

10 In Productivity by the numbers ‘growth cycles’ have been determined using statistical techniques and chosen to represent high points in capacity utilisation of the See Stats NZ (2020), ‘Productivity statistics: 1978–2020’ https://www.stats.govt.nz/ information-releases/productivity-statistics-1978-2022/ and Stats NZ (2007), ‘Extracting Growth Cycles from Productivity Indexes’.

11 One must always be careful to read the footnotes in such comparisons.

12 The former measured sector (MS-11) is available for the period from 1978 onwards and includes: Agriculture; Mining; Manufacturing; Electricity, Gas, Water and Waste Services; Construction; Wholesale Trade; Retail Trade; Accommodation and Food Services; Transport, Postal and Warehousing; Information Media and Telecommunications; and Financial and Insurance Services. The more recent measured sector (MS-16) starts in 1996 and includes the sectors in the MS-11, plus: Rental, Hiring and Real Estate; Professional, Scientific and Technical Services; Administrative and Support Services; Arts and Recreation Services; and Other Services.

13 In the case of cost weighting, this assumes the relative costs reflect the value society places on differences in This may be appropriate when better, more expensive ways of serving the public replace less expensive ones. However, in many cases, quality improvements can come through cost-saving innovations that also increase quality. For example, keyhole surgery can be cheaper, provide a better patient experience and be less risky than more invasive surgery.

14 EU KLEMS stands for EU level analysis of capital (K), labour (L), energy (E), materials (M) and service (S) The dataset also includes data for Japan, the UK and the US. INTANProd stands for Intangible Production, with information on investment and capital stocks for intangible assets that are not included in the national accounts. For more information see: https://euklems-intanprod-llee.luiss.it/ 

15 We discuss how innovation affects the economy in more detail in Part 4.

Part 3 | Productivity trends

The opportunities that come with advances in science, technology, transport, and innovation are huge and so our options to grow the value of our assets and business go well beyond the traditional focus.

David Tapsell | Pukeroa Oruawhata Trust


This chapter considers Aotearoa New Zealand’s productivity performance over time and compares it with other advanced economies. Our analysis is primarily based on two sources: Stats NZ’s most recent productivity statistics (1978–2022) and international data compiled by the OECD.


3.1 Aotearoa New Zealand’s productivity has been low for many decades

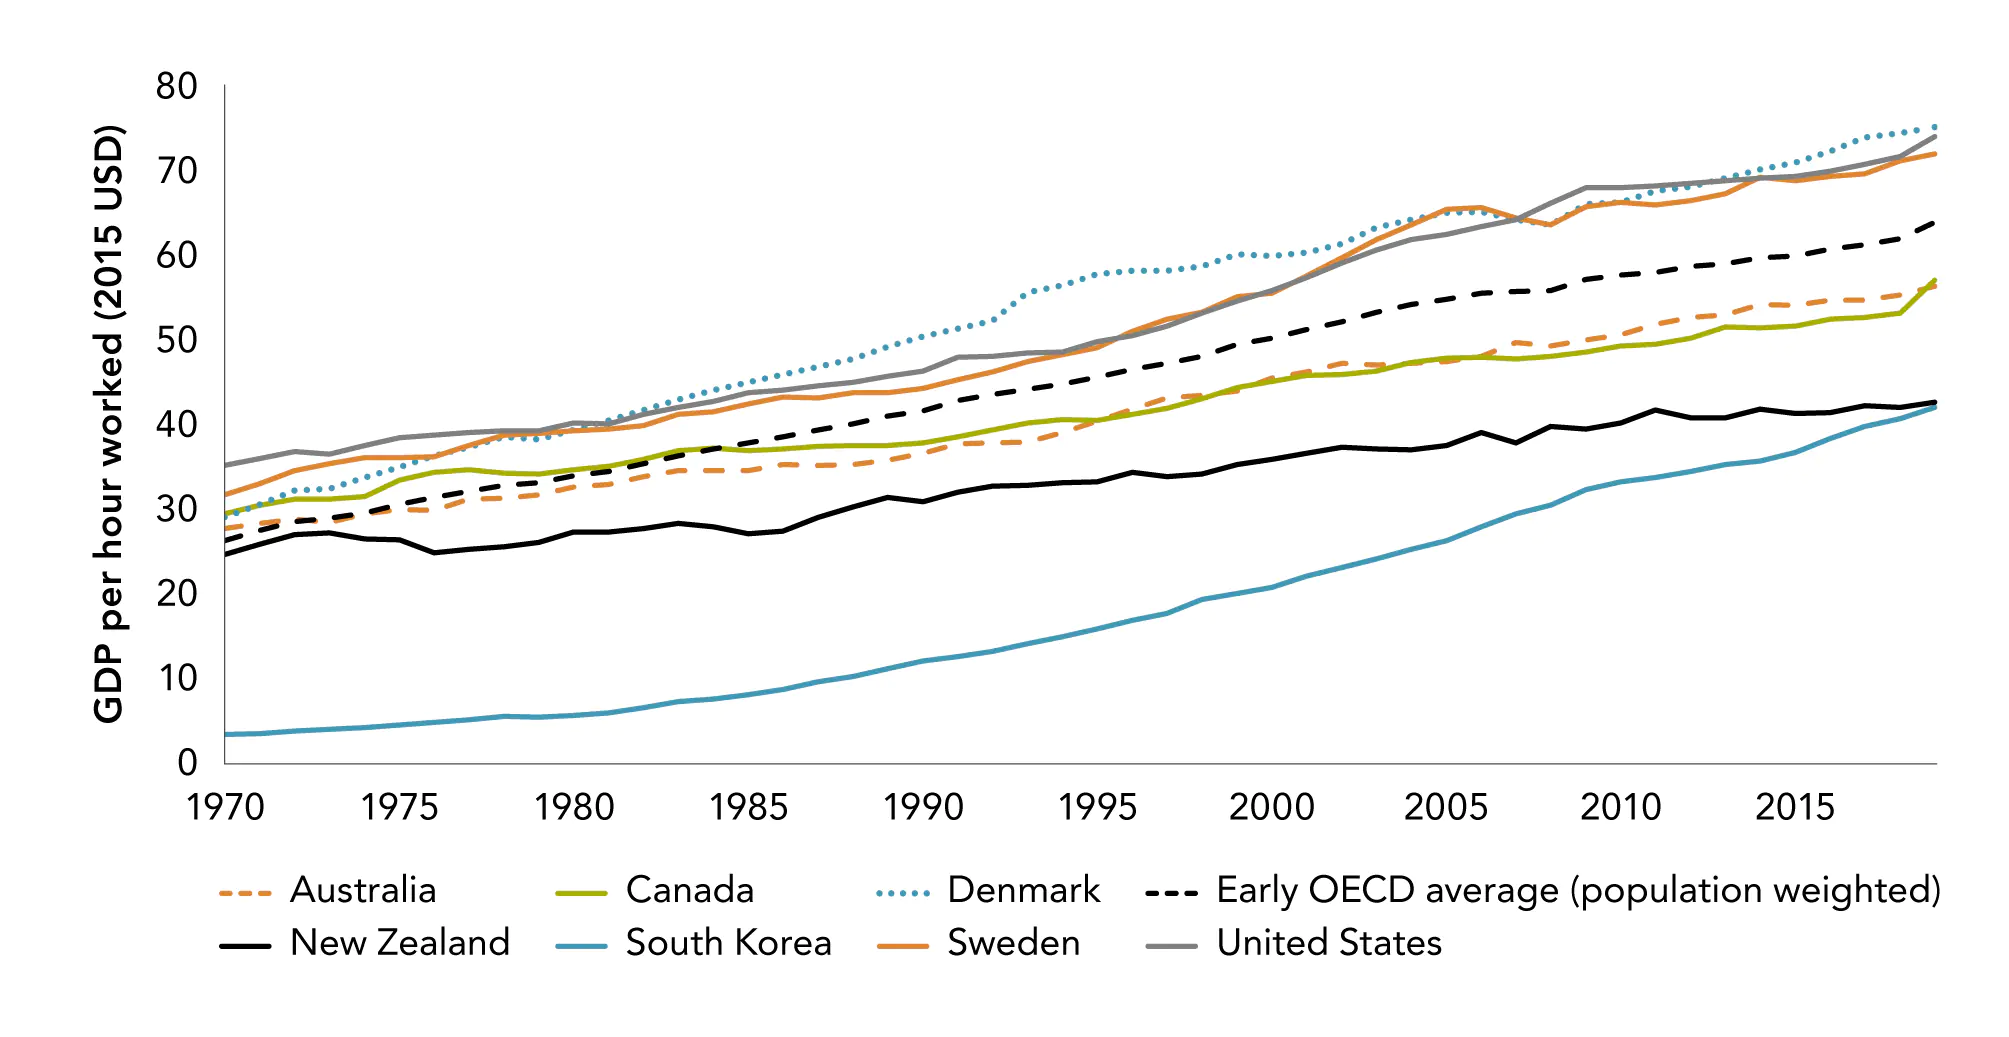
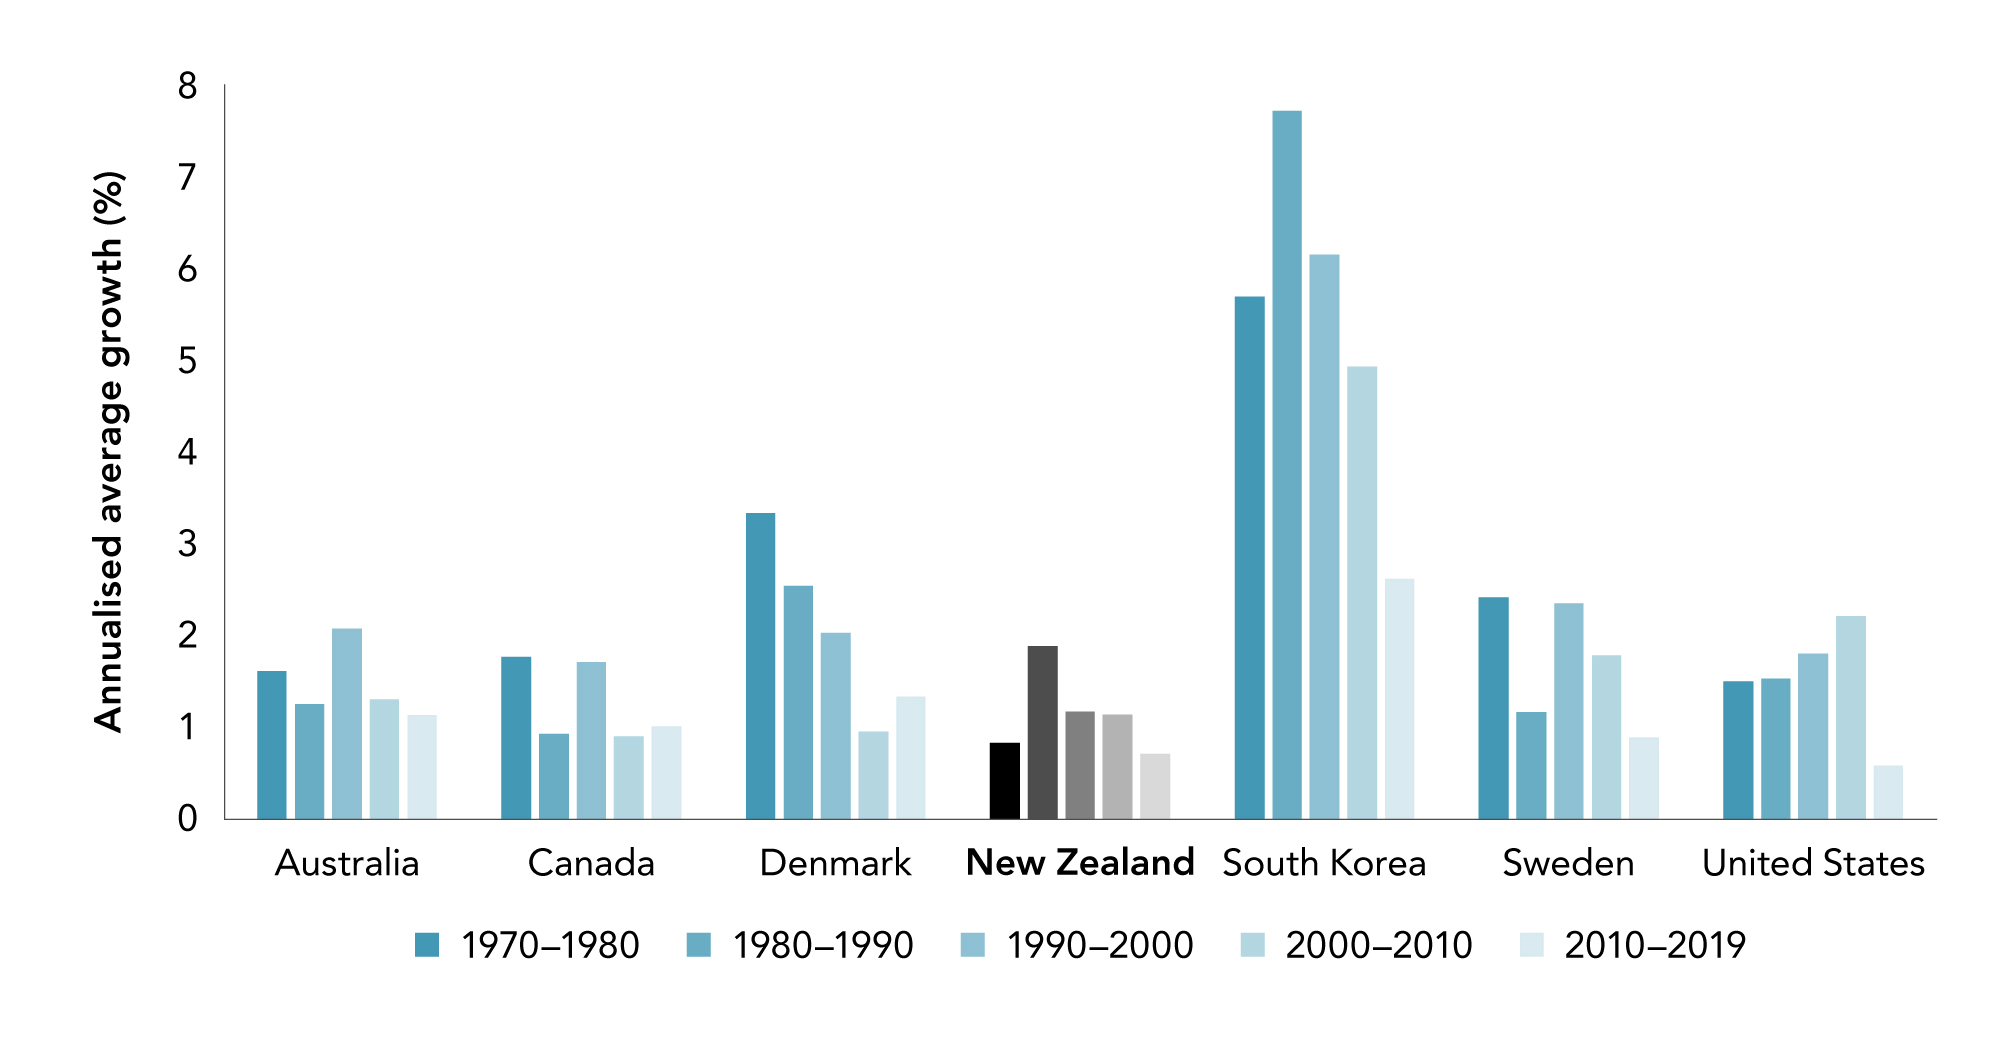
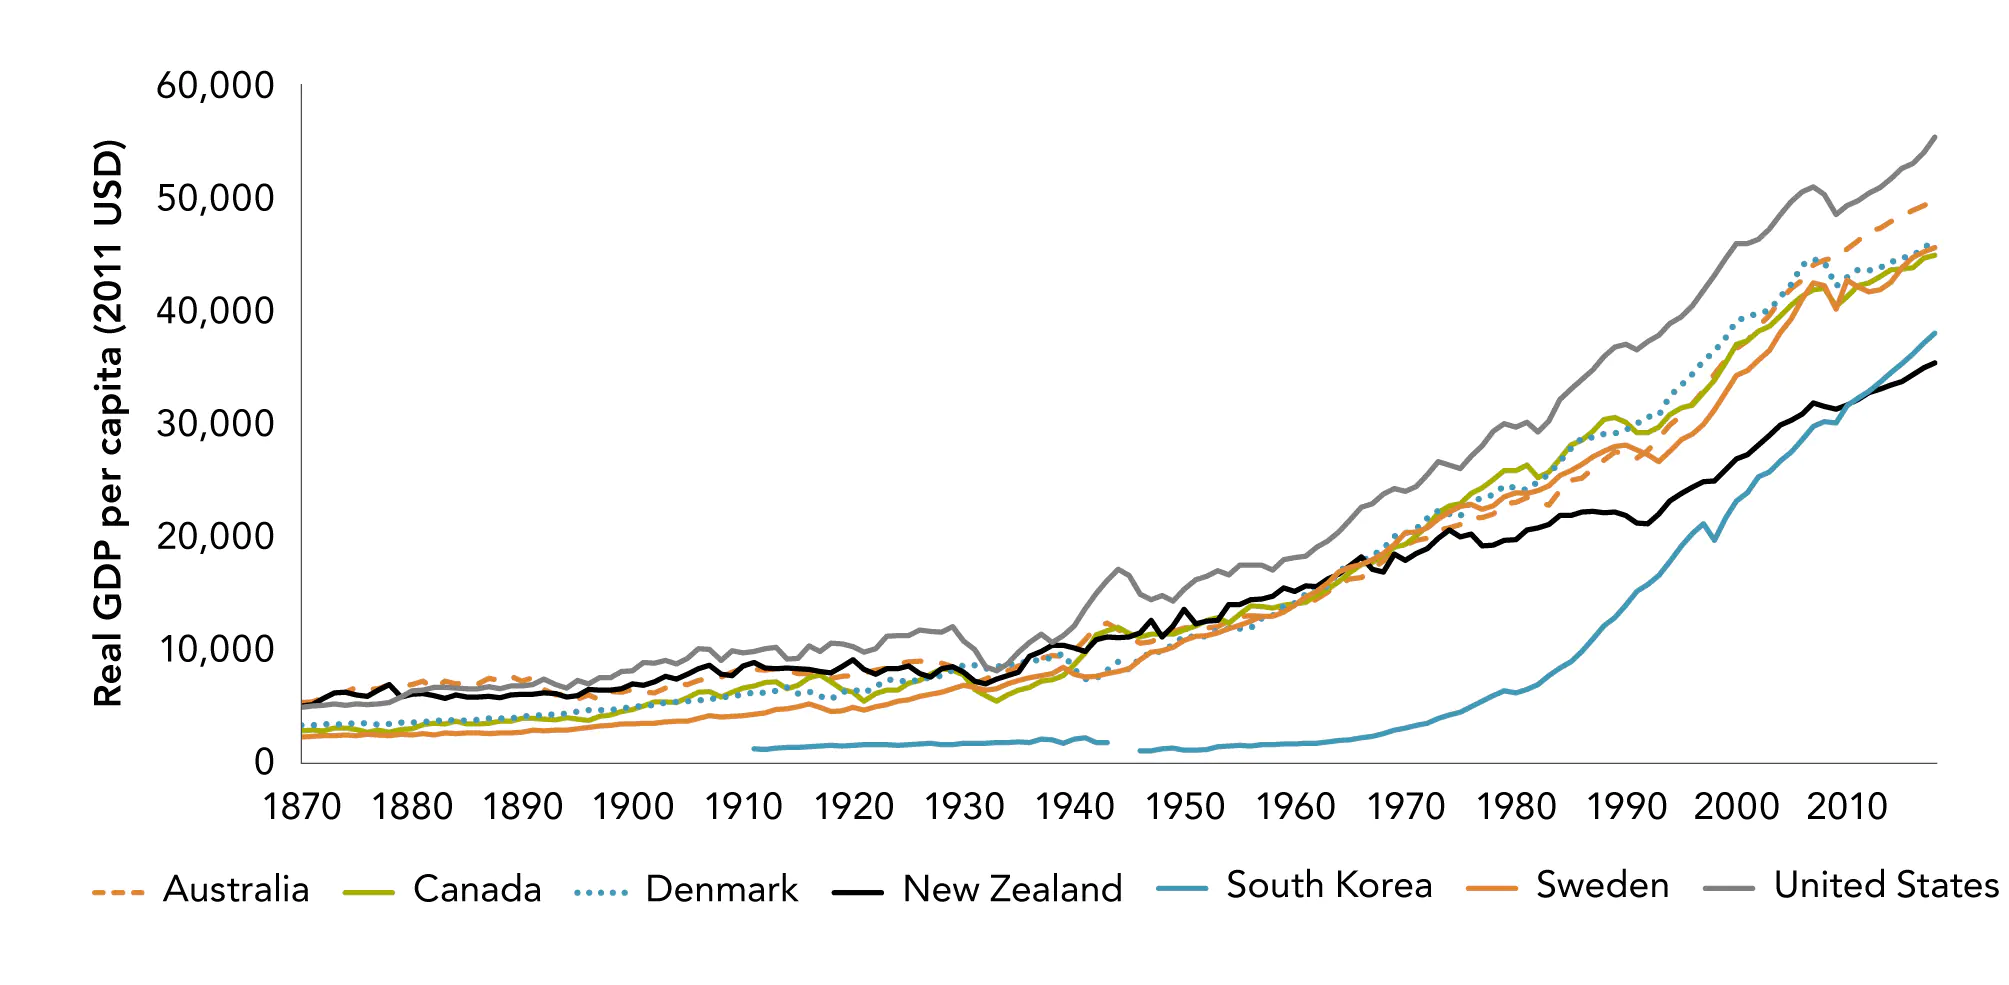
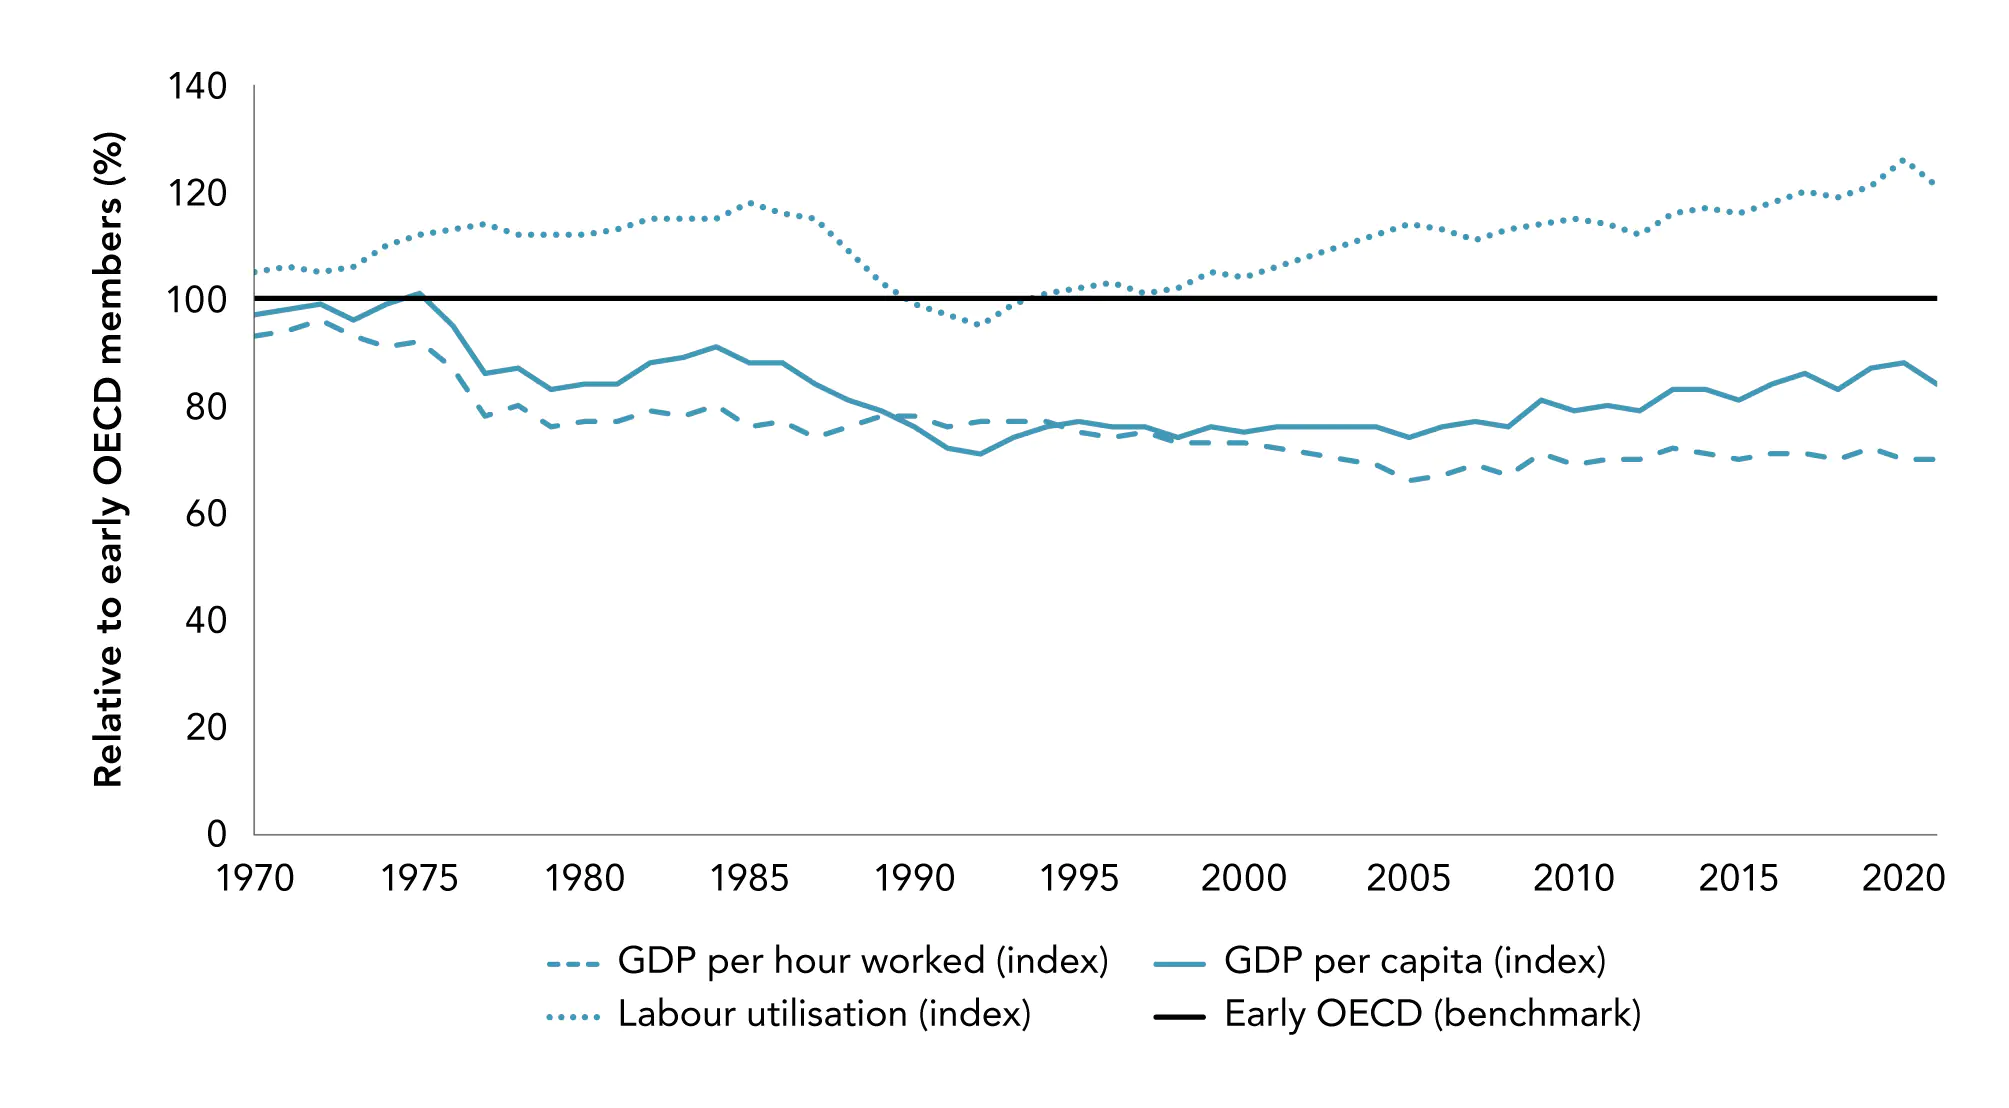
Aotearoa New Zealand’s workers have been producing less for every hour worked than those in other OECD countries for half a century (Figure 3.1). In 1970, New Zealand’s GDP per hour worked was only marginally below the OECD average – comparable with the average of other early OECD members, but below that of comparator countries such as Sweden and Canada. In the first half of the 1970s, New Zealand’s productivity dropped behind that of its peers, particularly after the Oil Shock of 1972. This marked the beginning of a long period of relative decline, with productivity levels continuing to diverge through to the mid-2000s.

Figure 3.1 Aotearoa New Zealand’s productivity has lagged behind other developed countries
GDP per hour worked, 1970–2020

Figure 3.1 Aotearoa New Zealands productivity has lagged behind other developed countries

Source: New Zealand Productivity Commission calculations, based on OECD Productivity Database.

Notes: Early OECD countries are defined as those who joined the OECD prior to 1975. This includes Australia, Belgium, Canada, Denmark, Finland, France, Germany, Greece, Iceland, Ireland, Italy, Japan, Netherlands, New Zealand, Norway, Portugal, Spain, Sweden, Switzerland, Turkey, the UK and the US.

Aotearoa New Zealand’s relative position stabilised in the 2000s, a period in which many OECD countries were seeing a slowdown in productivity growth (Figure 3.2). This widespread slowdown preceded the GFC in many cases and has continued into the 2010s. Several possible explanations for the recent global slowdown have been suggested. Changes in industry composition (such as decline in manufacturing) in many developed countries have contributed to a reduction in the relative size of the tradeable part of their economies. Industry composition in developed countries has instead shifted towards the services sectors, where measurement of productivity is more difficult (Pells, 2018). As noted in section 2.3 above, Baumol’s cost disease may affect these industries, because they are poorly suited to standardisation and (by implication) to substitution by technology, and because their quality depends (or is thought to depend) on the amount of human labour they involve (Baumol, 1996).

Some have argued the supply of economically transformational ideas has simply dried up or at least currently slowed down (Bloom et al., 2020; Gordon, 2018). Others have a more optimistic view that the slowdown is temporary, as firms better understand and implement new technologies, such as machine learning and artificial intelligence (Brynjolfsson et al., 2021). The impacts of major, pervasive technological change – or “general purpose technologies” also take time to manifest, because they come from complementary investments such as adjusting production techniques (ibid). Another explanation for the global slowdown is that the benefits of newer technology are not being spread or shared as widely as in the past, leading to an increasing productivity gap between the leading firms and the rest (Akcigit & Ates, 2019, 2021; Andrews & Criscuolo, 2019). Finally, the global productivity slowdown has been attributed to an increased propensity to save and decreased propensity to invest, leading to excess savings and downward pressure on demand, interest rates, and growth (Summers, 2016).16

Figure 3.2 Productivity growth globally has slowed since the 1970s
Growth in GDP per hour worked, by decade, 1970–2019


Figure 3.2 Productivity growth globally has slowed since the 1970s

Source: New Zealand Productivity Commission calculations, based on OECD data.

Notes:  Growth rates are annualised average growth calculated from USD, constant prices, 2015 PPPs.

3.2 Aotearoa New Zealand’s productivity over the longer term

Looking back in history, the numbers have not always been so bleak. According to estimates of GDP by Angus Maddison and others (Bolt & Van Zanden, 2020), Aotearoa New Zealand was one of the most productive economies in the world (alongside Australia, the UK and the US) at the end of the 19th century (Figure 3.3). As McCann (2009) noted, this equalisation is exactly what economic theory suggests would occur with such a “highly integrated set of bilateral trade, capital mobility and labour mobility relations” between the UK and New Zealand, Canada and Australia.17

Globally, there has been massive growth in productivity (as measured by output per person)18 since the 19th century. This has meant huge advances in life expectancy and poverty reduction. This growth built on, and has enabled, significant investment in productivity-enhancing factors like education, research, physical capital and infrastructure, technology, and knowledge.

In 1870, Aotearoa New Zealand was one of the leaders in terms of per capita output, and this continued until the Second World War (a period when the US was emerging as the global economic leader, to replace the UK). As the world rebuilt after the Second World War, older capital and infrastructure was replaced with newer versions, and technology developed during the war spread to civil society. This led to a post-war productivity boom in many economies. Although New Zealand stayed with the pack initially, GDP per capita largely stagnated between 1970 and 1990 – a period characterised by rapid growth in many other economies. This 20-year period of low growth left New Zealand towards the bottom of the list of advanced OECD countries. Since 1990, New Zealand’s growth has improved, but not enough to catch up with its peers.

Figure 3.3 Aotearoa New Zealand’s relative decline began in the mid-20th century
Real GDP per capita (20 1 USD), 1870–2018

Figure 3.3 Aotearoa New Zealands relative declinebegan in the mid 20th century

Source: New Zealand Productivity Commission calculations, based on Maddison Project Database 2020 (Bolt & Van Zanden, 2020).

3.3 The last half century

Although Aotearoa New Zealand’s growth rates of GDP per capita have been respectable over the past 20 years, this growth is more reflective of increased labour utilisation than increased labour productivity.

Compared with other early OECD members (those joining the OECD prior to 1970), the majority of Aotearoa New Zealand’s output and income growth has come from increasing the amount of labour input used, rather than the productivity with which it is employed (Figure 3.4). New Zealanders have been consistently working more hours than other OECD economies since the 1980s. This has meant that, although the productivity of New Zealand’s workers has declined relative to their peers (GDP per hour worked has dropped well below the average for early OECD member countries), the relative decline in per capita output in the 1970s and 1980s was less extreme and has reversed in the last couple of decades.

Figure 3.4 Aotearoa New Zealand’s growth has come from working more hours, rather than increased productivity
New Zealand’s performance relative to early OECD countries (Early OECD = 100)

Figure 3.4 Aotearoa New Zealands growth has come from working more hours rather than increased productivity

Source: New Zealand Productivity Commission calculations, based on OECD data.

Notes:  Figures are relative to the population weighted average of countries, which joined the OECD prior to 1975 (early OECD = 100).

Labour utilisation = hours worked per head of population.

We can separate the total hours worked by New Zealanders into two components: the number of employees and the number of hours worked by each of these employees.

Average hours per employee in Aotearoa New Zealand have remained quite stable since 1970. This trend is similar to the US (Figure 3.5). However, most early OECD comparators have seen a gradual decline in hours worked per employee, while Nordic countries like Denmark and Sweden have much lower (and falling) working hours, which may be due to a different work culture in those countries (Riekhoff et al., 2019).

Figure 3.5 New Zealanders continue to work long hours
Average hours worked per employee, 1970–2020

Figure 3.5 New Zealanders continue to work long hours

Source: New Zealand Productivity Commission calculations, based on OECD data.

Notes:  South Korea is not included in the graph; it grew rapidly and converged towards the OECD average.

Hours worked dropped rapidly, which confirms that, as they develop, economies have higher output because of higher productivity and not because of working longer hours.

Figure 3.6 Aotearoa New Zealand’s employment rate has recovered strongly since the 1990s
Employment rate (% of population), 1970–2020

Figure 3.6 Aotearoa New Zealands employment rate has recovered strongly since the 1990s

Source: New Zealand Productivity Commission calculations, based on OECD data.

Aotearoa New Zealand’s employment rate was very similar to Denmark and higher than the US and Canada, historically until the late 1980s. The employment rate then fell, as unemployment rose following the economic reforms of the 1980s. Although employment grew strongly from the mid-1990s onwards, it was not until the mid-2000s that the employment rate reached pre-reform levels. Like in many countries, New Zealand’s employment rate saw a further dip during the GFC, but it picked up strongly in the early 2010s, with rates exceeding many other OECD economies in the lead-up to the COVID-19 pandemic. Maré et al. (2017) found that average composition-adjusted skill of workers declined by 1.8% over the period 2001–2012, as growth in employment disproportionately attracted workers with lower-than-average skill levels.

It has been a different story for capital. Aotearoa New Zealand has supported its workers with a much lower level of capital than almost all OECD economies for the last half century. New Zealand’s capital stock per hour worked has remained at around half that of countries like Australia, Sweden, and the US. However, it has been dropping further behind other countries. Denmark deployed 81% more capital for every hour worked than New Zealand in 1970, but this had risen to 164% (that is, 2.5 times that of New Zealand) in 2019. South Korea’s capital per worker was a mere 15% of New Zealand’s in 1970 and, by 2019, this had risen to almost 50% higher than New Zealand’s.

Figure 3.7 Aotearoa New Zealand has long been a low-capital economy
Real capital stock per hour worked (2017, USD thousands)

Figure 3.7 Aotearoa New Zealand has long been a low capital economy

Source: Penn World Tables (PWT 10.01) (Feenstra et al., 2015).

Notes: Capital comprises nine asset types: residential buildings, other structures, information technology, communication technology, other machinery, transport equipment, software, other intellectual property products and cultivated assets (such as livestock for breeding and vineyards).

For more details on capital calculation see: Inklaar et al. (2019).

Sources of output growth

Between the end of the 1970s and the COVID-19 pandemic, the growth in output produced by Aotearoa New Zealand’s “former measured sector”19 can be divided into four periods: 1980s, 1990s, 2000 and beyond, and the COVID-19 period. (Figure 3.8). Output growth in the 1980s was driven by capital deepening – an increase in the amount of capital per worker. The New Zealand economy underwent significant change in the 1980s because of the Muldoon Government’s Think Big projects. This was followed by public sector reform, opening the economy up to international competition and transferring state enterprises to the private sector. This was associated with an increase of capital stocks and capital intensification (Diewert & Lawrence, 1999). In the first half of the decade, there was a large increase in labour input and a similar drop in the latter half of the decade. In contrast, the strong labour productivity growth of the 1990s was driven mainly by MFP – the more effective use of labour and capital.

In the first two decades of the 21st century, output growth has been driven largely by increasing labour input. The contribution of capital, on the other hand, has declined since the 1980s and 1990s. This failure of capital to grow in line with labour (even in the more recent environment of historically low interest rates) appears to have played a role in holding back Aotearoa New Zealand’s labour productivity since the GFC. The first year of COVID-19 saw a massive decline in labour input and almost no change to capital deepening. Labour and capital grew rapidly as the economy recovered in the following year.

Figure 3.8 Sources of growth have varied across economic cycles
Cyclical contributions to output growth, 1978–2022 (former measured sector)

Figure 3.8 Sources of growth have varied across economic cycles

Source: New Zealand Productivity Commission calculations, based on Stats NZ Productivity statistics: 1978–2022 (Stats NZ, 2023).

Notes:  Annualised growth rates.

The former measured sector includes ANZSIC06 industries AA1–KK1 and RS1. In contrast, the current measured sector includes LL1 (Rental, Hiring and Real Estate Services), MN1 (Professional, Scientific and Technical Services), MN2 (Administrative and Support Services) and RS2 (Other Services).

Figure 3.9 Cyclical contributions to output growth
Measured vs former measured sectors 1997–2022

Figure 3.9 Cyclical contributions to output growth

Figure 3.8 uses the longest time-series of productivity statistics produced by Stats NZ. A slightly different picture emerges when we expand our view to the newer definition of the measured sector (Figure 3.9). Stats NZ updated the measured sector to add service sectors that were more difficult to measure, such as professional, technical, and administrative services.20 Employment and output have been growing in these industries. The impact of their inclusion is that the current, broader measured sector does not reflect the same declines in labour in 1997–2000 as the former measured sector, because service sectors experienced strong increases in labour inputs. The impact of COVID-19 and the subsequent rebound were affected similarly. This highlights the structural change that has been occurring in Aotearoa New Zealand’s economy.

Structural change

Economies tend to evolve through certain stages. They start as agricultural economies, followed by a rise in manufacturing and then a shift to service industries. As with other developed countries, the share of national income generated by services has been increasing in Aotearoa New Zealand, particularly since the mid-1980s. The share of GDP generated by primary industries in New Zealand has historically been lower than goods producing or services industries, but it has also been falling over time.

The largest fall in this sector occurred in the mid-1980s, because of economic reforms. These included withdrawal of protectionist policies, such as import quotas, government subsidies for domestic industries and high tariffs. This trend is consistent with other developed countries, but it is important to note that primary industries still make up a relatively high share of New Zealand’s GDP compared to other developed countries.

Aotearoa New Zealand’s primary industries have long been productivity growth leaders, built off investment in research, technology and its subsequent diffusion and adoption (Lattimore & Hawke, 1999; Moughan, 20 1). There was comparatively rapid productivity growth in the primary industries over the 1980s and 1990s – driven by capital deepening and MFP growth – which is generally attributed to the wide-ranging economic reforms that reduced agricultural subsidies and regulation.21 During this time, many inefficient firms failed and others had to restructure comprehensively (Grimes & Wu, 2022). However, by the end of the 1990s, productivity growth was slowing down, only to increase again in the next century.

Figure 3.10 Most GDP growth since the 1980s has occurred in the services sector
Sectoral shares of GDP, 1972–2021

Figure 3.10 Most GDP growth since the 1980s has occurred in the services sector

Source: New Zealand Productivity Commission calculations, based on Stats NZ Productivity statistics: 1978–2022 (Stats NZ, 2023).

As noted earlier in this chapter, as economies shift to services, actual and/or measured productivity can decline, either because the opportunities for productivity improvements are fewer (Baumol, 1996) or because their outputs are more difficult to measure. However, this is not true for all industries within the services sector, as we can see in Figure 3.11, which shows relative productivity levels in 2019 on the vertical axis and labour productivity growth since 2000 on the horizontal axis. The size of the bubbles reflects the relative size (in terms of hours worked) of each industry, and their colour reflects relative growth in employment since 2000. Industries shown in green have seen a decline in total labour input over the past two decades, those in grey have grown relatively slowly, and those in blue have grown more rapidly.

Figure 3.11 Services industries present a mixed productivity picture
Productivity levels, productivity growth, and industry size

Figure 3.11 Services industries present a mixed productivity picture

Source: New Zealand Productivity Commission calculations, based on Stats NZ Productivity statistics: 1978–2022 (Stats NZ, 2023) and Stats NZ, National accounts (industry production and investment).

Notes: Mining; Electricity, Gas, Water and Waste Services; and Rental, Hiring and Real Estate Services are excluded from the graph. These industries are relatively small in employment terms, with very high capital intensity.

Two services industries (Financial and Insurance Services, and Information Media and Telecommunications Services) stand out as both having high current productivity levels (being higher up on the chart) and having experienced strong productivity growth (being further to the right). However, both remain quite small and grew only modestly over the first decades of the 21st century. In contrast, industries such as Accommodation and Food Services, and Administration and Support Services appear to follow Baumol’s (1996) prediction, drawing workers into areas with low productivity levels and growth.

Both goods-producing and services industries experienced strong labour productivity growth in the period between 1997 and 2000 (Figure 3.12).22 Since the turn of the century, productivity growth has been much higher in primary and service industries than in goods-producing industries.

Figure 3.12 Labour productivity (annualised average growth), 2008–2022

Figure 3.12 Labour productivity annualised average growth 20082022

Source: New Zealand Productivity Commission calculations, based on Stats NZ Productivity statistics: 1978–2022 (Stats NZ, 2023).

Reported public sector productivity growth has been low

Although industries dominated by the public sector are excluded from the measured sector, Stats NZ regularly publishes estimates for education and training, and healthcare and social assistance as part of its annual release of industry-level productivity measures. For many years, productivity measurement of the public sector has either been ignored or assumed to be constant, as outputs were measured by inputs. However, in the past two decades, there has been considerable work undertaken in this area, such as in healthcare (Bojke et al., 2017; Castelli et al., 2007; Stevens et al., 2006; Triplett, 2001) and education (Gemmell et al., 2018; O’Mahony & Stevens, 2006).23 Many countries now include measures for healthcare and education in their national accounts. These typically take the form of cost-weighted activity indices, where activities (such as numbers of children taught, or operations undertaken) are weighted by their relative costs.24

The productivity of the public sector matters because its outputs are important – health, education and policing affect the whole of society and, in particular, its more vulnerable members – and because it is both a large share of the economy and a significant employer.25

[The] public sector affects overall economic performance both through its direct contribution to the goods and services produced by the nation and through its indirect impact on other sectors through the provision of a well-educated and healthy workforce, quality infrastructure (both physical and institutional) and so forth.

Stevens (2006), p. 68

Figure 3.13 Productivity in the public sector
Labour productivity index, 1996–2022

Figure 3.13 Productivity in the public sector

Source: New Zealand Productivity Commission calculations, based on Stats NZ Productivity statistics: 1978–2022 (Stats NZ, 2023).

Figure 3.13 shows labour productivity indices for healthcare and education in Aotearoa New Zealand, compared with the measured sector. Productivity in the education and healthcare sectors has been persistently low compared to the measured sector. While measured sector labour productivity grew by 1.3% per year between 1996 and 2000, healthcare growth averaged 0.7% and education productivity shrank by 1.3%. Labour productivity in the education sector has been declining since 1996, which is when the series begins. This has been driven by slow growth in measured output, combined with much faster growth in inputs (particularly capital). The volumes of activity in education and health are driven by population dynamics, which evolve slowly. The influence of additional investments is likely to be affecting quality (such as moving from open heart to keyhole surgery in health). These improvements are not well measured in the current productivity statistic for these sectors, but it is possible to include in the future.26

3.4 Recent productivity trends

In this section, we examine what has changed since the previous Productivity by the numbers (NZPC, 2021b). The analysis presented in this section is based on the most recent release of Stats NZ’s productivity statistics from 1978–2022 (Stats NZ, 2023).

Although the latest figures understandably are of most interest, it is important to state that annual movements can be volatile and often do not reflect changes in the underlying drivers of productivity. Further, each new release of productivity statistics comes with revised historical data for both input and output indicators, resulting in updated productivity estimates for previous years.

Measured productivity varies over the economic cycle for both economic and measurement reasons, so economists generally focus on the longer-term patterns, and Stats NZ recommends focusing on productivity across growth cycles. Averaging over the whole economic cycle provides the best opportunity to understand the underlying position of productivity in Aotearoa New Zealand’s economy, removing cyclical variation in capacity utilisation. Even if investment expenditure varies over the business cycle in response to the availability of funds, the costs of borrowing and expectations of future sales and income can take a long time to feed into the capital stock. In addition, because capital utilisation is difficult to measure, it is generally held constant over the economic cycle by statistical agencies. The actual variation in capital utilisation will therefore appear in reported productivity. For example, in economic downturn, firms do not immediately sell capital items (unless they experience cashflow issues), so some will lie relatively idle until demand increases.

The impact of the COVID-19 pandemic was not like other recessions our economy has experienced. Productivity numbers are unlikely to be similar to other recessions for both economic and measurement reasons. The pandemic introduced a seismic shift to the economy and society, with long-lasting impacts on the way we work, travel, and socialise. Government interventions to minimise the economic damage of the pandemic also had an impact. This has had two major consequences. First, Stats NZ made changes to the way it calculates productivity and its components, for the statistics to be useful in the pandemic context. Second, the usual assumptions about economic behaviour did not hold. In bad times, firms with declining revenues will shrink or fail altogether. This was less likely to happen during the pandemic, due to the availability of subsidies, meaning there are a number of firms still operating that would otherwise have ceased (Bowman, 2022; McGowan et al., 2017; Pelosi et al., 2021).

The data in the following charts go up to the year ending March 2022. The COVID-19 pandemic and resulting lockdown have been among the most economically disruptive events in recent history, with Aotearoa New Zealand’s GDP falling by the largest amount on record in the June quarter of 2020, before rebounding dramatically in the following quarter. For labour productivity, the effect of a recession depends on the extent to which firms hold on to staff during a downturn and how much firms suffer declines in output. For example, Myers, (2009) argued that, during a downturn, labour productivity growth “would be expected not to fall as much as output growth in theory because it is the least productive workers that are laid off first and the more productive workers that are retained” (p. 20). Lockdowns had different effects on businesses, depending on whether they were classed as essential services, their location, the extent to which they could continue to operate despite workers being confined to their homes, and the availability of government assistance to maintain employment relationships. As we go on to explain below, the varied effects of lockdowns meant the economic response to COVID-19 was quite different to responses to other economic shocks.

The COVID-19 pandemic had a major influence on the economy

Figure 3.14 compares growth in GDP per capita and GDP per hour worked in Aotearoa New Zealand and other OECD countries. Events in 2020 were unprecedented for the entire world, and output in general was low for almost every OECD country. However, the impact of the pandemic on output per hour worked vs output per capita has been very different. During the lockdown period, labour input decreased, and capital utilisation reduced, leading to a dramatic drop in output per capita. This fall rapidly reversed in 2021, as people and firms returned to work. Both the 2020 decline and the 2021 recovery were relatively muted in New Zealand, perhaps reflecting the shorter duration of the 2020 lockdowns and the provision of government assistance to firms and workers, alongside continuing strict border controls and extended lockdowns (particularly in Auckland).

In contrast, output per hour worked remained strong in 2020, with many countries seeing growth in GDP per hour worked well above the average of the previous decade. Declining output per capita and rising output per hour was a combination of a decrease in total output and an increase in the average capacity of the remaining firms and workers. There are several reasons for this. As already noted, capital will not adjust as fast as labour, so this led to an increase in the effective capital-labour ratio within firms. In addition, as they are reducing labour input, firms will tend to reduce the hours of the least productive staff first wherever possible, increasing the average productivity of staff working. The COVID-19 pandemic experience is also a reminder that we should rely on long-term multi-year trends instead of the productivity figures for a single year.

Figure 3.14 Labour productivity (GDP per capita and GDP per hour worked), 2010–2021

Figure 3.14 Labour productivity GDP per capita and GDP per hour worked 20102021

Source: New Zealand Productivity Commission calculations, based on OECD data.

Figure 3.15 Quarterly hours worked and employment (seasonally adjusted)

Figure 3.15 Quarterly hours worked and employment seasonally adjusted

Source: New Zealand Productivity Commission calculations, based on Stats NZ Household Labour Force Survey data.

Notes:  Hours worked is the total number of hours worked in the economy in the quarter.

Figure 3.15 shows the impact of COVID-19 and subsequent government decisions on labour, with an upward trend in the number of people employed and the hours they worked.27 The first lockdown, which began on 26 March 2020 (with restrictions progressively lifted on 28 April, 13 May, and 8 June), resulted in a large drop in actual hours worked – over 9 million hours. Because of government support, the impact on the number of people employed was negligible. The hours worked bounced back in the following quarter (although not completely, because of a second outbreak in Auckland in August 2020) and returned to trend levels the quarter after that. There is a brief blip in hours worked related to lockdowns after the community outbreak in Papatoetoe on 14 February 2021. The final lockdown in August 2021, arising from cases in Auckland and other parts of the North Island, resulted in a drop of over 6 million hours worked (6.6%).

This faster adjustment of hours worked than people employed is something that is also seen over the business cycle. Firms tend to hold on to staff with hard-to-find or hard-to-acquire skills, even when activity declines, because of difficulties in replacing them when the demand for goods or services increases again. This is known as “labour hoarding”, and it results in total employment being less cyclical than output, and the employment of lower-skilled workers to be more cyclical than that of higher-skilled workers (Bertola & Caballero, 1994; Oi, 1962; Stevens, 2007).

Lockdowns, social distancing, and changes in work habits had very different impacts across industries (Figure 3.16). Declines in both output and labour input were strongest in the services sector, with large parts of this sector affected by reduced social interaction and ongoing travel restrictions. In contrast, primary sector growth remained strong between 2020 and 2021.

Although the availability of foreign staff (such as through the Recognised Seasonal Employer Scheme) dried up due to border restrictions, labour levels were maintained through the use of labour that would otherwise have been employed elsewhere (for example, in the hospitality sector), or through increased hours of work for existing staff (Maré et al., forthcoming; NZPC, 2022a). With input and output growth affected similarly, labour productivity remained at roughly the same level as in 2019–2020 (Figure 3.17).

Figure 3.16 Output and labour input growth, 2008–2022

Figure 3.16 Output and labour input growth 20082022

Source: New Zealand Productivity Commission calculations, based on Stats NZ Productivity statistics: 1978–2022 (Stats NZ, 2023).

Notes: Growth rates are annualised average growth calculated from index.

Values for 2021–2022 are based on provisional estimates.

Figure 3.17 Labour productivity, 2008–2022

Figure 3.17 Labour productivity 20082022

Source: New Zealand Productivity Commission calculations, based on Stats NZ Productivity statistics: 1978–2022 (Stats NZ, 2023).

Notes: Growth rates are annualised average growth calculated from index.

Values for 2021–2022 are based on provisional estimates.

This variation in outcomes is even clearer at the narrower industry level (Figure 3.18). Sectors such as Accommodation and Food Services, and Transport, Postal and Warehousing Services saw the most dramatic falls in labour input, with year-on-year declines of over 10% in hours worked. In Accommodation and Food Services, this related to a reduction in activity as people stopped going to the restaurants and cafes due to social distancing and home isolations, overseas tourists were unable to enter Aotearoa New Zealand, and businesses faced severe restrictions on the numbers of people who could be on the premises. However, as output declines were less pronounced than the decline in labour input, labour productivity growth in the industry was high. At the other end of the spectrum, some industries, and key services – including Healthcare and Social Assistance Services; Electricity, Gas, Water and Waste Services; and Financial and Insurance Services – saw an increase in labour inputs, with low or negative growth in labour productivity.

Figure 3.18 Labour productivity and hours worked during the COVID-19 pandemic

Figure 3.18 Labour productivity and hours worked during the COVID 19 pandemic

Source: New Zealand Productivity Commission calculations, based on Stats NZ Productivity statistics: 1978–2022 (Stats NZ, 2023).

The pandemic forced many firms to reassess their working processes and invest in technology. The most obvious manifestation of this has been the dramatic rise of video conferencing as an essential work tool, but there are many other examples (for example., the expansion of many “brick-and-mortar” retailers to online sales). Sectors such as Technical and Scientific Services remained robust during the turmoil due to the ease of working from home provisions.28 While the Information Media and Telecommunications sector saw a similar decline in labour inputs to the preceding two years, output from the industry increased strongly, resulting in a large rise in labour productivity.

16 For more discussion on the productivity slowdown, see the previous edition of Productivity by the numbers (NZPC, 2021b).

17 For more on Aotearoa New Zealand’s historical productivity story, see Part 3 of the previous edition of Productivity by the numbers (NZPC, 2021b).

18 Data on hours worked are not available back this far, so we focus on output per head of This provides a good indication of potential income per person, but obscures differences in hours worked – for example, due to cultural differences such as the extent to which women work outside the home.

19 As the economy has evolved and their methods for measuring inputs and outputs in more sectors have evolved, Stats NZ has expanded the number of industries in its productivity statistics. However, these extended series only go back as far as 1997. To decompose productivity into its components back further, we focus on the former measured sector – which goes back to 1978 but excludes some services sectors like rental and real estate For more details on the industries in the former measured sector, see notes to Figure 3.8 and see footnotes 12 and 20.

20 The current measured sector is defined as ANZSIC06 published industries AA1–AA3, BB1, CC1–CC9, DD1, EE1, FF1, GH1, GH2, II1, JJ1, KK1, LL1, MN1, MN2, RS1, and The industries that have been added – as compared to the former measured sector – are LL1 (Rental, Hiring and Real Estate Services), MN1 (Professional, Scientific, and Technical Services), MN2 (Administrative and Support Services) and RS2 (Other Services). This data is only available from 1996.

21 For more on this, see Box 7 on page 25 of the previous edition of Productivity by the numbers (NZPC, 2021).

22 We cover the periods during and after COVID-19 separately in section 4.

23 See (Simpson, 2009) for a useful overview.

24 For an early discussion of the methods used to calculate productivity statistics in education and healthcare by Stats NZ, see (Tipper, 2013).

25 “Often the private sector cannot be relied upon to produce these outputs efficiently and/or equitably. But the very reason why these services are provided by the public sector makes their management and the assessment of their performance problematic” (Stevens, 2006).

26 See, for example, Castelli et (2007) and Gemmell et al. (2018).

27 These figures are seasonally adjusted to identify changes more clearly.

28 According to data from (Stats NZ, 2020), the sectors in which people are most likely to work from home are Financial and Insurance Services (71%), Information, Media and Telecommunications (66%), and Technical and Scientific Services (59%).

Part 4 | The underlying determinants of productivity

Innovation through research and development helps boost productivity, and as a country we still under-invest in R&D, both at a business and a government level, compared to other countries.

Catherine Beard | BusinessNZ


Part 3 of this report examined several aspects of Aotearoa New Zealand’s recent and long-term productivity performance. In Part 1 and Part 2, we noted that this productivity performance is not simply ordained by a higher power; rather, it depends crucially on investments we have made maintaining, improving, and adding to our productive capacity. To understand how we might improve New Zealand’s productivity and wellbeing, we need to understand more about the factors that underpin it. These are areas where government can help – or harm – the economy.

We will now look at some of the underlying determinants of productivity (see Figure 2.6), to shed some light on the elements that are not explicitly measured or do not appear as components in the national accounts.

  • Innovation
  • Investment, capital and financial markets
  • International linkages
  • Business dynamics and capability
  • Skills and education
  • Infrastructure
  • Institutions

These underlying determinants broadly align with what The Treasury’s (2021) LSF29 refers to as “The Wealth of Aotearoa New Zealand” and “Our Institutions and Governance” (p. 3). In this publication, we focus in more detail on the aspects that most impact wellbeing through their relationship with productivity.                                           

This examination will not be exhaustive, but it gives an indication of things that matter and areas where we might improve.

Box 6 What drives improvements in the productivity of nations? 

Towards the end of the 20th century, economists began to look beyond simple explanations of why some nations were more prosperous than others, based on raw labour, capital, and an unexplained residual. Models and evidence developed elsewhere were brought into macroeconomic models. These included the role and importance of:

  • improvements in the quality of labour and capital inputs, for example the role of skills and human capital (Lucas, 1988);
  • developments in financial and intermediation services (Greenwood & Jovanovic, 1990);
  • competitive rivalry and “creative destruction” of low-productivity firms by higher performing ones (Aghion & Griffith, 2008); and
  • institutions – including coordinating organisations, understanding the “rules of the game”, and changing social norms (Acemoglu & Robinson, 2012).

However, underlying them all is the creation and adoption of new technology (Grossman & Helpman, 1991; Romer, 1990). Technological progress occurs when new goods and services, production, and organisational methods are devised, or when existing ones are improved upon – in short, when there is innovation. Innovation is not an end in itself; it is merely the first stage in a broader process where knowledge becomes economically useful.

4.1 Innovation

Innovation is fundamental to improving living standards generally and to productivity growth. It is the dynamic and uncertain process through which economic actors create new economic value by creating, adopting, and adapting knowledge into new or improved products and services, operational processes, organisational and managerial processes, and approaches to marketing.

Entrepreneurship is the activity of seeing these opportunities and undertaking the work necessary to take advantage of them.

There are four key elements underpinning the creation and use of knowledge:

  • Creation – The creation of new or altered, economically/socially useful
  • Dispersion – How this new knowledge
  • Absorption – How individuals and organisations take in and understand innovations and the opportunities they create.
  • Adoption – How individuals or organisations implement innovations, to action them and to generate benefits of their own from the new knowledge.

For our economy and society to prosper, all these aspects need to be functioning well. Our ability to do them depends upon the investments we make in our capabilities and how we use them.

For example, innovation requires individuals with certain skills. Not all innovation requires the same set of skills. Many innovations emerge from research and development by individuals or groups with a very specific set of skills. Knowledge in an area is often seen as the necessary foundation of innovation – we must understand a product or process, or the need for it, before we can improve it. However, the lack of what is seen as skills or knowledge allows people to think of entirely new solutions to problems. Other innovations appear out of the application of entrepreneurial skills to technical knowledge, or the bringing together of two types of seemingly unconnected knowledge.30

A well-functioning economy creates new solutions to existing problems, as well as to things we never dreamed about. Many of these solutions will be unique to Aotearoa New Zealand and its economic, social, cultural, and environmental context. It is important to note, however, that most new ideas originate elsewhere in the world. The transfer of this knowledge to New Zealand and shaping it to fit our context is vital to building a healthy economy.

There are a range of explanations to account for why we observe slower uptake of new technologies in some countries, compared to others (Kneller & Stevens, 2006). These centre around:

  • the barriers to new technologies that result from a country’s institutional arrangements (Parente & Prescott, 1994; Prescott, 1998);
  • the usefulness of technologies – new technologies are typically developed in richer countries, and differences in economic conditions and factor prices can make these technologies inappropriate for less developed countries (Acemoglu & Zilibotti, 2001);
  • economic geographical factors – for example, a country’s distance from where new technologies are being developed or used (Keller, 2002, 2004); and
  • the potential of a country to absorb into its economy capital and new technology from elsewhere (Eaton & Kortum, 1999; Griffith et , 2004; Xu, 2000).

Aotearoa New Zealand’s ability to absorb, adapt and adopt new ideas and technology relies on complementary investments we make to improve our capability. Research and development and skills are vital in this regard (see Box 7).

Box 7 Research and development, and skills

Research and development not only creates new ideas and ways of working, but it is an important means for innovations from elsewhere to be absorbed into firms and the economy (Cohen & Levinthal, 1989; Griffith et al., 2004; Kneller & Stevens, 2006). Research includes discovering what others are doing; development is about applying these discoveries to a specific situation. For dispersed knowledge to be absorbed, organisations need individuals with the ability to understand the new knowledge and its implications. This is not entirely an issue of technical skills (that is, that a scientist is needed), but requires managerial skills (how the organisation deals with its environment), and entrepreneurial skills (interpreting the commercial potential of innovation) (Bloom et al., 2012; Caselli & Coleman, 2001; OECD, 2022a).

Rosenberg (1972) argued that the skill level of workers and the state of the capital goods sector are two important determinants of the diffusion of technology and of its adoption (B. H. Hall & Khan, 2003; Rosenberg, 1972). More recently, Caselli & Coleman (2001) found that computer adoption is associated with high levels of human capital. Kneller & Stevens (2006) found that human capital has two faces: a factor of production in and of itself, and as an instrument for the absorption of productive knowledge.


Investing in innovation

Research and development, especially that financed by businesses, plays an important role in generating new knowledge, facilitating technology transfer, and the absorption of knowledge from other firms and countries.

Figure 4.1 Aotearoa New Zealand has low investment in R&D

Figure 4.1 Aotearoa New Zealand has low investment in RD

Source: New Zealand Productivity Commission calculations, based on OECD.Stat Main Science and Technology Indicators (MSTI) database.

Notes:  BERD = Business expenditure on R&D.

GovERD = Government expenditure on R&D.

HERD = Higher education expenditure on R&D.

Aotearoa New Zealand invests a lower proportion of its GDP in R&D than most OECD countries (Figure 4.1). Countries such as Finland and Denmark reinvest twice as much of their economic output in R&D in total than New Zealand does. This is particularly true when we look at New Zealand’s level of business expenditure on R&D (BERD). The figure has been increasing slightly, but remains well below that of our peers (NZPC, 2023b, p. 24).

Low levels of R&D in Aotearoa New Zealand can be explained in part – but not totally – by our distance from world centres, our small firm size, and an industrial structure weighted towards primary production (Crawford et al., 2007; OECD, 2017b).

Research and development is an input to innovation. We can also consider the outcomes of innovation. Figure 4.2 shows the proportion of firms in each manufacturing industry that have introduced a new or significantly altered product (good or service) in 2020 and 2021. Aotearoa New Zealand’s performance varies across industries. It sits in the middle of the pack in many industries (such as the manufacturing of food, beverages and tobacco products), but towards the bottom in others (such as the manufacturing of transport equipment, electrical equipment and basic metals).

Aotearoa New Zealand’s poor-to-middling performance across multiple industries can be partly attributed to a lack of large businesses, or else their nature, the industries they operate in, or their market power. In most countries, large businesses are between two to three times more likely than small and medium enterprises to introduce products that are new to market (OECD, 2017c, p. 154). In New Zealand, large businesses and SMEs are both low performers in terms of all types of innovation: product, process, marketing, and organisational innovations (ibid).

Figure 4.2 Aotearoa New Zealand’s innovation performance varies by industry
Percentage of firms reporting product innovation, OECD countries 2021

Figure 4.2 Aotearoa New Zealands innovation performance varies by industry

Source: New Zealand Productivity Commission calculations, based on 2021 OECD Innovation Indicators Dataset by Industry. Notes: A product innovation occurs when a firm produces a new or significantly altered product.

4.2 Investment, capital and financial markets

As we saw in (Figure 3.7) in Part 3, Aotearoa New Zealand is “capital shallow”. There has been little sign of convergence over the past half-century, except for an increase in the 1980s and perhaps a slight catch-up in recent years. A convergence would need a major shift in investment in New Zealand, relative to its peers. As noted in Part 2, one advantage of a low level of capital is that we have to put less aside from income to maintain it (Grimes & Wu, 2022), but this only makes sense if the costs exceed the benefits.

Gross fixed capital formation (GFCF) is the annual investment in products and structures that are expected to be used in production for several years. Aotearoa New Zealand’s GFCF, as a percentage of GDP, averaged 23.5% over the last decade (Figure 4.3). This is almost identical to the figure for the previous decade. In contrast, the GFCF as a percentage of GDP for several of New Zealand’s peers (for example, northern European countries) has increased; for others, such as Italy and the US, it has fallen. Although New Zealand’s recent investment in GFCF looks similar to that of its peers as a proportion of GDP, there are several reasons for concern. As evidenced by Figure 3.7, even an average level of investment over two decades has not been enough to narrow the gap in capital intensity with our high-income comparator countries. This may be a reflection of the distinction between investment per worker (or per capita) and investment as a proportion of GDP – with low GDP per capita and high employment rate and hours worked (Figure 3.5 and Figure 3.6), New Zealand needs to invest a higher proportion of output than our peers to maintain a constant capital–labour ratio. Aggregate figures may also hide some important differences between different types of assets. This is examined further below.

Figure 4.3 GFCF as a percentage of GDP

Figure 4.3 GFCF as a percentage of GDP

Source: New Zealand Productivity Commission calculations, based on OECD.Stat, National Accounts at a Glance.

Machinery and equipment investment adds to the productive physical capital stock. It often embodies new technology and contributes to productivity (Boucekkine et al., 20 1; Johansen, 1959). Aotearoa New Zealand’s investment per employee in machinery and equipment is lower than that of most OECD countries. However, it remains above some common comparators such as Australia and Canada, which (along with others, including Denmark, Norway and Italy) have seen lower levels of investment in machinery and equipment in the decade to 2021 compared with the 2000s (Figure 4.4).

Figure 4.4  Employees in Aotearoa New Zealand work with less machinery and equipment
Investment in machinery and equipment per employee, 2000–2021

Figure 4.4 Employees in Aotearoa New Zealand work with less machinery and equipment

Source: New Zealand Productivity Commission calculations based on OECD.Stat, National Accounts at a Glance and OECD Productivity Database.

Notes:  Average annual GFCF per employee, thousands of USD, constant 2015 prices and PPPs.

Machinery and equipment includes ICT equipment, office machinery and hardware, and weapons systems. It excludes transport equipment.

Investment in dwellings is another component of overall GFCF. This has been rising in Aotearoa New Zealand relative to our peers in nominal terms, but not in real terms, because prices have risen precipitously but supply has not. Despite an increase in residential construction in New Zealand over the last decade, the number of dwellings per inhabitant remains below the average for the OECD (Fitchett & Jacob, 2022). This increased investment is reflected in rising property prices. Although several other economies have experienced increasing house prices in recent years, the rate of increase is highest in New Zealand (Fitchett & Jacob, 2022). Work by the Infrastructure Commission (New Zealand Infrastructure Commission, 2022a) suggests that housing supply has become less responsive to demand in recent decades, relative to the period between the late 1930s and 1970s.

Finance

Firms need access to finance to invest. They can do this through retained earnings or profits, or from external sources such as banks, private equity, the share market, venture capital, and informal capital markets. These different finance sources can play different roles during the growth cycle of firms (Berger & Udell, 1998).

Well-functioning stock markets are important for economic growth in general, and for productivity (Levine, 2005; Levine & Zervos, 1998). Aotearoa New Zealand’s domestic share market capitalisation, measured by market capitalisation as a percentage of GDP, is smaller than that found in comparator countries (Figure 4.5). New Zealand’s share market did not experience as much growth as that achieved by comparator countries prior to the GFC. The market capitalisation of listed domestic companies in New Zealand has begun to rise in recent years, but is still much lower than in countries such as Australia, the UK and the US. This may reflect a lack of financial capital overall, the attractiveness of alternative investments (such as housing), or may reflect that New Zealand firms prefer to list abroad, because of the costs involved, or to be closer to their foreign markets.

Figure 4.5  Aotearoa New Zealand has an underdeveloped equity market
Market capitalisation of listed domestic companies as a percentage of GDP

Figure 4.5 Aotearoa New Zealand has an underdeveloped equity market

Source: New Zealand Productivity Commission calculations, based on the World Bank’s World Development Indicators.

Data for Denmark and Sweden (not available after 2004) sourced from www.ceicdata.com

Figure 4.6 Venture capital is low
Investment in venture capital as a share of GDP, 2007 and 2021

Figure 4.6 Venture capital is low

Source: New Zealand Productivity Commission calculations, based on OECD.Stat National Accounts at a Glance. Notes: Data for first period for Japan is for 2009. Data for first period for Australia and the US is 2019.

Venture capital is a relatively small proportion of the economy in most OECD countries, but it plays an important role in the innovation and entrepreneurial ecosystem (Fenn et al., 1997; Hellmann & Puri, 2000). The size of Aotearoa New Zealand’s venture capital market industry relative to GDP is much smaller than in most other OECD countries (Figure 4.6). The US, Canada, South Korea, Finland and Denmark have seen investment in venture capital surge in recent years, but New Zealand has not experienced an increase in venture capital.

In the absence of deep share markets and venture capital markets, firms must turn to banks and informal sources of capital. However, the cost of bank borrowing in Aotearoa New Zealand is high. Our interest rates are high when compared to similar countries (Figure 4.7). Until the late 1990s, Sweden had much higher interest rates. Joining the Euro currency appears to have required much lower interest rates in many European countries. Since that time, few advanced economies have had higher interest rates, except for Australia post GFC. With its economy less affected than others by the financial collapse (because of its reliance on primary industry, which was fuelling China’s massive growth), this was a period in which Australia had to keep interest rates high to prevent its economy overheating.

Prior to the GFC, Aotearoa New Zealand’s interest rates were significantly above those in other advanced economies and have remained at or near the top. This high cost of borrowing increases the cost of investment, as it requires higher future returns to make investments viable.

Figure 4.7 Short-term interest rates

Figure 4.7 Short term interest rates

Source: New Zealand Productivity Commission calculations, based on OECD Main Economic Indicators.

Environmental capital

The environment is part of the bedrock wealth of society, particularly for those economies that rely on agriculture and tourism. As noted in section 2.3 above, measurement of the state of an economy’s environment is difficult, but developments have been made in this area. Although not usually considered to be a “produced capital” (in that it was here long before humans existed), we can invest in maintenance of our environment or, more crucially, we can disinvest in it. Natural resource depletion is the sum of net forest depletion, energy depletion and mineral depletion, and Figure 4.8 provides results from the World Bank’s (2011) analysis of the depletion of natural resources. Aotearoa New Zealand’s disinvestment in its environmental capital has been decreasing and is considerably lower than Australia’s, which appears to be trending upwards. Nevertheless, our rate of disinvestment is falling more slowly than in countries like Denmark and is still positive – that is, we are continuing to run down our environmental capital. This measure does not include broader measures of biodiversity or air and water quality, for example, but these measures are also being developed. New Zealand’s investment, or disinvestment, in all these aspects of environmental capital will be an important determinant of our future wellbeing, both directly, and through their impact on the economy, consumption and incomes.

Figure 4.8  Disinvestment in environmental capital
Natural resource depletion as a percentage of GNI

Figure 4.8 Disinvestment in environmental capital

Source: World Bank staff estimates based on sources and methods in World Bank (2011).

Notes:  Natural resource depletion is the sum of net forest depletion, energy depletion and mineral depletion.

Net forest depletion is unit resource rents times the excess of roundwood harvest over natural growth.

Energy depletion is the ratio of the value of the stock of energy resources to the remaining reserve lifetime (capped at 25 years). It covers coal, crude oil and natural gas.

Mineral depletion is the ratio of the value of the stock of mineral resources to the remaining reserve lifetime (capped at 25 years). It covers tin, gold, lead, zinc, iron, copper, nickel, silver, bauxite, and phosphate.

4.3 International linkages

International linkages are important for productivity and economic performance, because they support the flow of knowledge from overseas, help foster business relationships, provide markets for exports, as well as knowledge about these markets, and they support the import of technology embodied in new equipment. All developed economies import and export sizeable proportions of their GDP. Likewise, with capital flows, the stock of foreign direct investment (FDI) is equivalent on average to around half of GDP for OECD economies.

International linkages are also important conduits for the flow of ideas – through trade in goods and services, foreign investment, or the flow of people.

International trade creates linkages with external markets, purchasers, suppliers and competitors. This enables new products and techniques to be observed, and tacit knowledge to be transferred via personal interaction. This has been referred to as “trade knowledge spillovers”.31 Further, access to larger overseas markets enables successful firms to expand, shifting resources to higher productivity uses within the domestic economy and increasing the returns to innovation and capital deepening. Fabling & Sanderson (2013) showed that Aotearoa New Zealand firms that enter export markets increase both employment and their capital–labour ratio relative to similar non-exporters, increasing both aggregate productivity (through reallocation) and firm productivity (through capital deepening).

Foreign investment is usually accompanied by knowledge that is embodied in:

  • organisational change – “use this money to do Y” or “you can only have this money if you do X” (see also example in human capital below);
  • new capital – “here are some new machines”, or “use this money to buy Y”; or
  • human capital – “we are sending our managers to run the show”.

However, even within multinationals, knowledge flows may be impeded by insufficient skills in subsidiaries (Birkinshaw et al., 2008).

As well as the benefits to the economy, the choices of firms to undertake internationalisation activities are related to their own productivity (see Box 8).

As knowledge is embodied in people, the flow of people equates to the flow of knowledge (although not all flows of knowledge may be new knowledge). Skilled workers potentially bring with them knowledge of different things to do, and different ways to do them. Movement of workers between firms (and the possibility of being able to do this) is an important mechanism that, it has been argued, underlies some of the benefits of migration (Bedford & Spoonley, 2014; NZPC, 2022a) and the agglomeration of economic activity (Andersson et al., 2007; Maré & Graham, 2013).

Trade

Aotearoa New Zealand has a relatively low export intensity (value of exports as a percentage of GDP) given its size (Figure 4.9), and this level is not rising, whereas, until the GFC, trade intensity was rising for many other small OECD countries. Small economies typically have high trade-to-GDP ratios, and New Zealand’s levels of trade are likely to be affected by its distance from major markets.

Figure 4.9 Export intensity and population

Figure 4 v2.9 Export intensity and population

Source: New Zealand Productivity Commission calculations, based on OECD.Stat National Accounts at a Glance.

Consistent with international evidence, firms in Aotearoa New Zealand that export are more productive and invest more in capital and innovation than non-exporting firms (Fabling & Sanderson, 2013; Sin et al., 2014). The requirements for New Zealand firms will be greater because of the distance to markets, and the fact that a small domestic economy makes it difficult for firms to achieve scale (NZPC, 2021a).

The level of, and variation in, the exchange rate affects international trade. Although exchange rate movements are an important part of the economy adjusting to economic shocks, excessive medium-term exchange-rate volatility may reduce domestic activity and international trade. Highly variable exchange rates can make it difficult for firms to export goods and services. For example, a sudden rise in the value of the New Zealand dollar can turn a previously profitable sale to a loss, as the exporter receives fewer New Zealand dollars for each unit of currency the foreign buyer pays. The New Zealand dollar has experienced significant volatility compared to the currency of our major trading partners (Figure 4.10). This makes it riskier for firms to export and makes them less willing to do so. Fabling & Sanderson (2015) showed that the level and volatility of the New Zealand dollar against bilateral trading partners affect both the number of firms exporting to a given market and the average value of exports per continuing firm.

Figure 4.10 The NZ dollar experiences wide swings relative to trading partners
Exchange rate index (1950 = 1,000)

Figure 4.10 The NZ dollar experiences wide swings relative to trading partners

Source: New Zealand Productivity Commission calculations, based on OECD Library exchange rates.

Notes:  Annual exchange rate index relative to the US dollar.

Index, 1950 exchange rate = 1,000. A decline in the index implies that a unit of domestic currency (for example, one New Zealand dollar) is worth fewer US dollars.

Aotearoa New Zealand’s exports are concentrated in animal and food products (Figure 4. 1), more so than exports from similar-sized economies. Other developed countries tend to export a wider range of goods – in particular, a wider range of elaborately transformed goods, embodying greater technological complexity. Research has shown that countries exporting a wider range of more complex products are more successful (Hausmann et al., 2007, 2014; Hidalgo et al., 2007). The lack of complexity in New Zealand’s exports may reflect the relatively low levels of frontier knowledge in our economy (Hartmann et al., 2017; Hidalgo, 2015), which would be consistent with our low levels of R&D

Figure 4.11 Merchandise exports in Aotearoa New Zealand are heavily concentrated in food & beverages
Products exported by similar-sized economies, 2019 (5–6 million population)

Figure 4.11 Merchandise exports in Aotearoa New Zealand are heavily concentrated in food beverages

Source: New Zealand Productivity Commission analysis of United Nations COMTRADE data.

Foreign investment

Exporting (and importing) ideas via capital – by investing and producing abroad, rather than producing onshore and shipping goods and services overseas – is one way to overcome the physical costs of distance. Aotearoa New Zealand’s relative outward Foreign Direct Investment (FDI) performance, however, is even lower than its export performance. Whereas the OECD average, and that of countries such as Denmark, has increased considerably over the past decade, New Zealand’s Outward Direct Investment (ODI) as a percentage of GDP was low in 2005 and remained low in 2021 (Figure 4.12).

In contrast, FDI into Aotearoa New Zealand has traditionally been quite high – well above the OECD average in the early 2000s. However, although the stock of investment into comparator countries has continued to increase, inward FDI as a percentage of GDP in New Zealand has been largely stagnant for the past two decades (Figure 4.12).

Box 8 Types of Foreign Direct Investment (FDI)

Horizontal FDI: How firms choose to service a foreign market. They have at least two potential approaches to doing so. The first is to export goods (or services) directly from Aotearoa New Zealand to the foreign market. The second is to set up multiple production plants in different foreign markets. If it is more profitable to do the latter, a multinational enterprise will emerge (Greenaway & Kneller, 2007; Markusen, 1984). Other models of horizontal overseas direct investment (ODI) and FDI are outlined in Horstmann & Markusen (1987, 1992) and Markusen & Venables (1998, 2000).

Vertical FDI: The internal fragmentation of the production process or supply chain. A specific example of the more general issues about vertical integration was the Nature of the Firm in the 1930s considered by Ronald Coase (Coase, 1937). In this case, firms may find it more profitable to conduct different parts of their processes in different countries (Helpman, 1984; Helpman & Krugman, 1987).


Foreign Direct Investment can happen for several reasons. It could be as a substitute for direct trade in goods and services, or it could be resource seeking. Aotearoa New Zealand may have economically valuable resources that attract foreign multinationals and capital. These could be natural resources such as oil or minerals, logs, or good pasture. They could also be intangible resources, such as businesses with innovative products or services.

FDI is an important source of funding for investment by firms and can be an important way to spread ideas. The OECD has noted that Aotearoa New Zealand’s foreign screening process has traditionally imposed “significant compliance costs and uncertainties on foreign investors, constraining service trade” (OECD, 2022b, p. 51). These have reduced in recent years, but the jury is out on whether this is enough to attract additional investment.

Figure 4.12 Inward FDI has been falling, outward FDI is among the lowest in the OECD
Stock of inward and outward FDI as a percentage of GDP

Figure 4.12 Inward FDI has been falling outward FDI is among the lowest in the OECD

Source: New Zealand Productivity Commission calculations, based on OECD data.

4.4 Business capability

Management capability has a significant impact on organisational performance. Skilled managers add to productivity and profitability by creating an environment where innovation and skill development can flourish (Fabling & Grimes, 2007). The (no-longer recent) Management Matters study (Agarwal et al., 2020; Green & Agarwal, 20 1) used the survey responses of managers in the manufacturing sector, who were questioned across three broad areas of management practice: operations management, performance management and people management. Overall management practices in Aotearoa New Zealand manufacturing were weaker than in most of the OECD countries for which data was available – New Zealand ranked 10th out of 14 OECD countries covered. A particular weakness identified in New Zealand manufacturing firms was in people management.

Aotearoa New Zealand was behind world leaders in all three dimensions of management practices measured (Figure 4.13). New Zealand manufacturing firms were weakest in people management (12th out of the 14 OECD countries covered) – managing human capital by attracting, developing and retaining talent. New Zealand ranked 9th and 10th for performance management and operations management, respectively. Although other countries have built measures of management into the ongoing suite of economic statistics (Scur et al., 2021), New Zealand participated in only a single wave of the study. However, longitudinal analysis of data on business practices from the Business Operations Survey suggest that there has been limited overall change in practices since the Management Matters study (Sanderson, 2022). These business practice changes have also been found to be related to the performance of firms (Fabling & Grimes, 2007, 2010, 2014).

Figure 4.13 Management capability has been low, especially people management capability
Components of management capability in medium and large manufacturing firms, 2009

Figure 4.13 Management capability has been low especially people management capability

Source: Green & Agarwal (2011).

4.5 Skills and education

Education levels, skills, and talent are fundamental to economic development, because more highly educated, skilled, and talented people tend to be more innovative and productive. Highly skilled and educated people create and embody knowledge and ideas, and they help facilitate the uptake of ideas from within Aotearoa New Zealand and internationally.

Skills and talent are influenced by formal learning processes, informal experiences, networking, and social and cultural norms.

The percentage of adults of working age with a bachelor’s degree or higher in Aotearoa New Zealand is close to the OECD average (Figure 4.14). A large proportion of these adults have a bachelor’s degree, with the numbers of those with a master’s or doctoral degree being much lower.

Figure 4.14 Tertiary qualifications levels are about average in the working-age population
Percentage of 25–64 year olds with tertiary education, 2021

Figure 4.14 Tertiary qualifications levels are about average in the working age population

Source: New Zealand Productivity Commission calculations, based on OECD Education Counts.

Percentage of 25–64 year olds with tertiary education, 2021

Aotearoa New Zealand’s average status regarding tertiary education in the young working population is partly due to our large diaspora. In 2020, the New Zealand diaspora was 17% of the resident population – there was one New Zealand-born person overseas for every six people living in New Zealand (NZPC, 2022a). This is comparable with eastern European countries such as Latvia (20%) and Estonia (16%). Tertiary qualification rates among the New Zealand-born population living overseas are notably higher than for the New Zealand resident population (Figure 4.15). In the short term, this reduces the supply of skilled labour for firms and affects their growth. In the longer term, there could be productivity benefits if these emigrant graduates return and bring with them knowledge of foreign markets and ways of working.

Figure 4.15 Our emigrants are more likely to be highly educated
Percentage of Aotearoa New Zealand diaspora aged 15 years or over with tertiary qualifications

Figure 4.15 Our emigrants are more likely to be highly educated

Source: NZPC (2022a) Immigration by the numbers.

Notes: Figures represent the percentage of New Zealanders abroad with tertiary qualifications, except the final column which is the figure for the whole New Zealand population (from Figure 4.14).

Cognitive skills provide an indicator of the quality of schooling and underlie the relationship between education and economic development. Aotearoa New Zealand participates in international studies assessing the quality of compulsory education – the Programme for International Student Assessment (PISA) and Trends in International Mathematics and Science Study (TIMSS). These tests have a broad focus on mathematics and science, and PISA has an additional focus on literacy.

In PISA, where the emphasis is on understanding and applying knowledge using data and examples, achievement levels by 15-year-olds in Aotearoa New Zealand have traditionally been close to the top of the OECD.32 Achievement levels in PISA, however, have seen a considerable decline in relative and absolute terms (Figure 4.16).

Figure 4.16 The quality of maths, science and reading literacy have been declining for some time
PISA score for Aotearoa New Zealand compared to OECD


Figure 4.16 The quality of maths science and reading literacy have been declining for some time

Source: New Zealand Productivity Commission calculations, based on OECD PISA.

Notes:  Rebased relative to OECD average to make subject scores comparable.

The above patterns could be explained by saying requirements for maths, science and literacy are somehow different in Aotearoa New Zealand, or that we value other aspects of the curriculum more highly. However, this is not supported by a New Zealand–specific study: the National Monitoring Study of Student Achievement (NMSSA). NMSSA is a large-scale assessment that monitors trends in student achievement and progress in the New Zealand curriculum. One aspect the NMSSA highlights is significant disparities in learning across the system. For example, students at the most economically disadvantaged 30% of schools display learning outcomes considerably behind the remainder of the population in all areas of the curriculum (Figure 4.17). There is one exception where the inverse is true – namely, the results for Te Reo Māori. Ākonga Māori (Māori students) scored higher overall than non-Māori students on the Te Reo Māori assessment at both Year 4 and Year 8, and they also made greater progress between these periods. This result reflects the concentration of Kura Kaupapa Māori in lower-decile areas and their success in teaching Te Reo.

Figure 4.17 There are substantial inequalities in educational achievement across the curriculum
Mean scores of Year 8 students by socioeconomic group

Figure 4.17 There are substantial inequalities in educational achievement across the curriculum

Source: New Zealand Productivity Commission calculations, based on National Monitoring Study of Student Achievement.

Notes: Mean results from most recent assessment year by subject area.

Low = most economically disadvantaged schools, according to the old decile system.33

Mid = middle four deciles according to economic disadvantage.

High = least economically disadvantaged schools.


4.6 Infrastructure

Aotearoa New Zealand has invested a similar share of GDP into infrastructure as other high-income countries (Figure 4.18). We have invested heavily in telecommunications, and this is important for a sparsely populated country, far from the rest of the world. Despite our low overall population density, New Zealand’s investment in transport infrastructure is about the same as that of other OECD countries.

These numbers are relative to our low-to-middling GDP, and it is also important to note separate price and volume effects. If infrastructure is cheaper or more expensive than in other countries, our interpretation of these figures will be different.

Figure 4.18 Aotearoa New Zealand has invested a similar share of GDP into infrastructure as other high-income countries, with a heavy weighting on telecommunications
Investment in infrastructure networks as a share of GDP, 2007–2020

Figure 4.18 Aotearoa New Zealand has invested a similar share of GDP into infrastructure as other high income countries

Source: New Zealand Infrastructure Commission, (2021), p. 4.

Statistical analysis of data in Oxford Global Projects and produced by the NYU Marron Institute by the New Zealand Infrastructure Commission (2022) found that unit costs for urban and rural motorways, road tunnels and underground rail are higher, on average, in Aotearoa New Zealand than in other high-income countries. Cost differences for surface rail stations, transmission lines, wind farms and hospitals are not statistically significant.

The New Zealand Infrastructure Commission (2022) also notes that the existing evidence base for benchmarking infrastructure costs between countries is limited and does not usually cover Aotearoa New Zealand. Therefore, they have undertaken an exercise to collect and analyse relevant data. Figure 4.19 shows there is no simple story about whether our input costs are higher or lower than those of other high-income countries.

Construction labour costs are an important component of the costs of building infrastructure. Aotearoa New Zealand has below-average construction labour costs, and average construction wages in New Zealand are around 35% lower than in Australia. Concrete is another major component of physical infrastructure. New Zealand has higher concrete costs than other high-income countries (twice as expensive as concrete costs in Australia). Costs for steel are similar to other high-income countries but almost 30% more expensive than in Australia.

Overall, Aotearoa New Zealand has average costs for materials used in vertical construction (structural steel, concrete, timber and “finish” materials). Construction equipment costs, however, are high – around 50% higher than for the median high-income country, and similar to those in Australia.

Finally, infrastructure must compete for other uses of land. Despite our sparce population, Aotearoa New Zealand has comparatively high rural land prices, which is likely to reflect our comparatively productive agricultural land.

Figure 4.19 Aotearoa New Zealand and Australia’s construction input costs relative to ten other high-income countries


Figure 4.19 Aotearoa New Zealand and Australias construction input costs relative to ten other high income countries

Source: New Zealand Infrastructure Commission, (2022), p. 6.

Notes: Horizontal line (= 100) represents median costs in the following countries: Canada, France, Germany, Ireland, Japan, the Netherlands, Singapore, the UK, and the US.

4.7 Institutions

Cultural, economic, legal, political, and social institutions are fundamentally important to the functioning of the economy and society (North, 1991), and they are major reasons for the vast differences among nations (Acemoglu & Robinson, 2012).

The government plays an important role in the functioning of the economy. It sets the “rules of the game” by creating institutions that underpin the business environment. It is also a major player in the economy, itself, and it provides education, health and other services. Aotearoa New Zealand compares well with other OECD countries in dimensions such as the rule of law, control of corruption, and property rights – the bedrocks of a functioning society and economy.

Institutional quality

The quality of institutions is a foundation of successful societies and economic development. Data from the United Nations Worldwide Governance Indicators34 ranks Aotearoa New Zealand highly in terms of government effectiveness and regulatory quality. The data also ranks New Zealand highly on a measure of “voice and accountability”, which captures perceptions of the extent to which a country’s citizens can participate in selecting their government, as well as freedom of expression, freedom of association, and a free media.

Figure 4.20 Institutional quality
Percentile rank

Figure 4.20 Institutional quality

Source: United Nations Worldwide Governance Indicators.

Trust

Trust forms a crucial cornerstone of well-operating democracies, as it fosters the implementation of policies and aids in the successful management of crises like the COVID-19 pandemic. It is an enabler of social and economic activity and an assessment of the quality of our institutions. Trust also plays a pivotal role in addressing future challenges, such as global warming, in a sustainable manner.

Figure 4.21 shows the share of people who report having confidence in the government. Trust in Aotearoa New Zealand is higher than the average in the OECD and other countries participating in the 2021 OECD Trust Survey. However, it has fallen in the last decade. In New Zealand, trust is highest in the police (73%) and the courts (65%), and lowest in local government councillors (45%) and the media (35%). Just over half (56%) of New Zealanders reported trusting the public service, which is above the OECD average (50%), but only in the middle of the benchmarking group of small, advanced economies and other English-speaking countries considered for this study.

Figure 4.21 Trust in government
Percentage of population who trust their national government

Figure 4.21 Trust in goverment

Source: OECD Trust Survey.

Notes:  The data shown reflect the share of respondents answering “yes” (the other response categories being “no”, and “don’t know”) to the survey question: “In this country, do you have confidence in… national government?” The sample is ex ante designed to be nationally representative of the population aged 15 and over. This indicator is measured as a percentage of all survey respondents.

Business environment

The business environment the government creates through its regulatory and other actions is an important element of the functioning of the economy. Fundamentals, such as corruption and the rules of law, can hold back economies at early stages of development. The competitive environment is an important determinant of the dynamics of the economy. There are a range of ways policy can affect this, such as through minimising the costs of entry and enabling flows of investment and goods. The OECD rates Aotearoa New Zealand’s product market regulation as generally good. Overall restrictions of competition are slightly lower than the average OECD country and small advanced economies (such as Denmark and Sweden). The OECD ranks the administrative burden on start-ups as low (see also Figure 4.23) but it considers high state ownership limits competition in the network sector.

Productivity is low by international comparison owing to muted product market competition, weak international linkages and innovation, and skills and qualifications mismatches.

OECD (2022b), p. 11

Aotearoa New Zealand’s small size and geographical remoteness may mean we must be even more vigilant regarding competition. It may be easier for firms with monopoly power to exercise market power. Smaller markets can also mean lower incentives for firms to enter the market and compete for economic rents.

Figure 4.22 Product market regulation is generally good
OECD Product Market Regulation Indicator, (6 is most restrictive)

Figure 4.22 Product market regulation is generally good

Source: OECD Product Market Regulation Indicator.

Notes: This chart displays the overall Product Market Regulation Indicator value as well as its selected sub-components.

Other small advanced economies (SAE) are Austria, Belgium, Denmark, Finland, Ireland, Israel, the Netherlands, Norway, Sweden and Switzerland.

Figure 4.23 Aotearoa New Zealand has a business-friendly environment
Ease of doing business index (lower = more business-friendly), 2019

Figure 4.23 Aotearoa New Zealand has a business friendly environment

Source: World Bank data.

Low costs (financial or otherwise) of entry create a more dynamic economy. This can increase “static” competition at any given point in time, but it can also enable new products and services or ways of working to emerge. Although competitive outcomes may be limited by our size and distance, Aotearoa New Zealand’s policy and regulatory settings are supportive of a well-functioning and competitive business environment (Figure 4.23).

Business dynamics

As at 31 December 2022, there were 711,599 registered companies in Aotearoa New Zealand. In the final quarter of 2022, 1,980 new companies were incorporated and 10,880 were removed from the company register.35 However, not all these firms produce products and services at any point in time or employ staff. According to Stats NZ’s Business demography statistics, in February 2022, there were 592,704 “economically significant” enterprises in 628,940 business locations, employing 2.4 million paid employees (Table 4.1).36 Around 13% of these firms were new, and 9% ceased.

Table 4.1 Firm dynamics

Number of enterprises, enterprise births, and enterprise deaths


2013

2014

2015

2016

2017

2018

2019

2020

2021

2022

Number of enterprises

477,633

495,675

508,152

517,911

532,077

537,756

549,324

560,193

564,240

592,704

Enterprise births

47,388

54,456

64,737

60,405

68,529

62,883

67,971

60,735

65,646

74,415

Enterprise birth rate

10%

11%

13%

12%

13%

12%

12%

11%

12%

13%

Enterprise deaths

44,343

36,189

52,134

50,538

54,213

56,556

56,217

50,241

56,730

53,889

Enterprise death rate

9%

7%

10%

10%

10%

11%

10%

9%

10%

9%

Turnover rate

19%

18%

23%

21%

23%

22%

23%

20%

22%

22%

Source: Stats NZ (2022).

Notes:  Care must be taken when analysing the 2022 births and deaths data. Deaths in particular are highly provisional. Turnover rate is the sum of the enterprise birth rate and the enterprise death rate; due to rounding, turnover rate may not always equal the sum of the birth and death rates.

Care must always be applied when comparing business dynamics statistics of countries. There can be a range of legal and data-collection reasons for difference. With this in mind, the statistics we do have suggest that Aotearoa New Zealand has high rates of firm births and deaths relative to other OECD countries (Figure 4.24). There does not appear to be a shortage of “creative destruction” in the New Zealand economy.37

Figure 4.24a Aotearoa New Zealand has a high rate of firm birth
Birth rate of firms, excluding non-employing firms

Figure 4.24a Aotearoa New Zealand has a high rate of firm birth and death

Source: New Zealand Productivity Commission calculations, based on OECD SDBS Business Demography Indicators. Notes: Excludes non-employing firms.

Figure 4.24b Aotearoa New Zealand has a high rate of firm death
Death rate of firms, excluding non-employing firms

Figure 4.24b Aotearoa New Zealand has a high rate of firm birth an death

Source: New Zealand Productivity Commission calculations, based on OECD SDBS Business Demography Indicators. Notes: Excludes non-employing firms.

4.8 What this means for Aotearoa New Zealand’s productivity performance

By looking at several of the underlying determinants of productivity, we are seeking to understand Aotearoa New Zealand’s performance and identify areas where we might want to improve. We appear to do the basics right, we have good institutions, and we have trust in them. These are necessary conditions for a functioning economy. However, we are not doing as well in some of the other determining factors.

Innovation is the engine of growth and productivity, and Aotearoa New Zealand invests in this much less than our peers do. We have relatively small share and venture capital markets, and the cost of borrowing is high. The quality of New Zealand’s education system shows signs of decline – in absolute terms and relative to our peers – and it produces highly unequal outcomes. Education is one of the most important investments we make in our people, and universal education provides us with the skills and knowledge we need to lead successful lives. The fact that educational outcomes are unequal suggests there is more we can do. This inequality is not only inequitable, but a terrible waste. Education can improve the lives of individuals and communities, as well as the performance of the economy.

Education is the most powerful weapon which you can use to change the world.

Nelson Mandela, speech, Madison Park High School, Boston, 23 June 1990

29 See discussion in section 1.1.

30 For more on how skills relate specifically to R&D, see Box 7.

31 For example, Caselli & Coleman (2001) found that computer adoption is associated with high levels of manufacturing trade openness vis-à-vis the More generally, see Coe et al. (1997), Coe & Helpman (1995), Grossman & Helpman (1990) and Howitt (2010).

32 In TIMSS, where the focus is on curriculum-based assessment with emphasis on knowledge and reasoning, 13- and 14-year-old students in Aotearoa New Zealand were in the bottom half of the OECD countries participating in Evidence suggests that this difference can be largely explained by the differences in structure and content of the two tests.

33 Deciles were ratings used by the Ministry of Education to determine some of the funding for schools. A school’s decile indicated the extent to which the school draws its students from low socioeconomic communities. Decile 1 schools were the 10% of schools with the highest proportion of students from low socioeconomic communities.

34 https://info.worldbank.org/governance/wgi/

35 Source: Latest company statistics: Numbers of company incorporations, removals and insolvencies, New Zealand Companies Office: https://www.companiesoffice.govt.nz/insights-and-articles/latest-company-statistics/.

36 An enterprise is economically significant if it meets any one of the following criteria: annual expenses or sales (subject to GST) of more than $30,000; 12-month rolling mean employee count of greater than three; part of a group of enterprises; registered for GST and involved in agriculture or forestry; or over $40,000 of income recorded in the IR10 annual tax return (this includes some units in residential property leasing and rental).

37 The term “creative destruction” was coined by Schumpeter (1942) to describe the process where innovation leads to a reallocation of resources, as established businesses shrink and fail, and new businesses are created and grow.

Part 5 | How to improve productivity

Productivity is the realisation of potential. How might we live within our means individually, as whānau, and as a globe, while still growing and realising our potential? I think this is a real challenge for this and future generations.

Hinerangi Edwards | Poutama Charitable Trust


This report presents a picture of Aotearoa New Zealand’s productivity performance, to support an informed debate about how we can improve the wellbeing of New Zealanders. The road to improvement sits with a wide range of actors. Successful economies are based on individuals and communities, firms and whānau, iwi, and education and research institutions all doing the best with what they have.

Over the past 12 years, the Productivity Commission has conducted inquiries into various aspects of productivity and the economy, providing detailed research, analysis, and recommendations (Table 5.1). Our current inquiry, Improving economic resilience, focuses on economic resilience policies that can proactively improve the capacity of industries and communities to adapt to persistent supply chain disruptions shaped by climate change, geopolitics, fragmenting trade or pandemics.

Through our past inquiries, we have made a wide range of recommendations to help improve understanding of productivity, and to inform and empower government and change makers to support productivity growth. As we reflect on the numbers presented in this report, we draw on some of the recommendations we have made in these past inquiries.

Table 5.1 Published Productivity Commission inquiries

Inquiry Date Subject
A Fair Chance for All: Breaking the cycle of persistent disadvantage June 2023

How do we improve economic inclusion and social mobility for those experiencing persistent disadvantage?

Follow-on review – Frontier Firms May 2023

A follow-on review of the Government’s policy settings to determine whether the productivity dial is shifting.

Immigration settings October 2022

What immigration policy settings would best facilitate New Zealand’s long-term economic growth and promote the wellbeing of New Zealanders?

New Zealand firms: Reaching for the frontier

April 2021 How can the economic contribution of frontier firms be maximised?

Technological change and the future of work

March 2020

What are the current and likely future impacts of technological change and disruption on the future of work, the workforce, labour markets, productivity and wellbeing?

Local government funding and financing

December 2019 How can the system of local authority funding and financing be improved?

State sector productivity

March 2019 How can we measure and improve state sector productivity?

Low-emissions economy

August 2018 How can New Zealand transition to a low-emissions economy?

Better urban planning

March 2017 What is the most appropriate urban planning system for New Zealand

New models of tertiary education

March 2017 How may trends in technology, internationalisation, population, tuition costs and demand for skills drive changes in models of tertiary education?

5.1 Investment is the key to improving productivity

There are many factors that influence Aotearoa New Zealand’s productivity. Some of these factors are harder to influence than others – for example, New Zealand’s size and distance from the rest of the world. Although the impact of these factors needs to be considered, we must take a broad view and be open to looking in other areas where we could work to improve our productivity.

Productivity is a long game. Productivity today depends on investments made in previous years and generations. The choices we make today will influence our productivity and standard of living tomorrow and for future generations.

In essence, it is investment in the wealth of Aotearoa New Zealand that is the key to improving productivity. In this chapter, we take the opportunity to build on the underlying determinants discussed in this report. We highlight the range of investments required in our physical, intangible, human, social, cultural and environmental capital, as well as in governance and the institutions that provide firms, markets, and civil society with confidence to engage in economic and business activity. To do so effectively, we should strive to better measure and monitor the outcomes of those investments.

Human capability

Investment in our people is one of the most important things that, as a society, we can make. Human capital is fundamental to prosperity and wellbeing, and an important explanation of differences in productivity across countries, industries and firms (Hanushek & Woessmann, 2010; Lucas, 1988, 2015; Mincer, 1984). Human capital includes knowledge and skills acquired through formal education as well as through “learning by doing”. It affects our economic development as a factor of production itself – similar to any type of productive capital – and through its effect on productivity. In particular, skills and knowledge enable innovation to disperse and be absorbed (Cohen & Levinthal, 1989; Kneller & Stevens, 2006; Robbins, 2016).

The nation’s education system is perhaps the single most important source of human capability. Aotearoa New Zealand has long had a high-quality education system, but the skill level of our learners when they leave the education system is falling, relative to previous cohorts and to other advanced economies. Evidence in national and international studies has shown wide disparities in educational outcomes across socioeconomic groups and ethnicities (Gromada et al., 2020; Jagger & Stevens, 2019; OECD, 2018). The disparities in the education outcomes across ethnicities in New Zealand remain a source of considerable loss of productivity and wellbeing. This represents a loss of potential now and for future generations, not only for individuals and communities, but for businesses and government.

Internationally, there are concerns about the long-term impact of COVID-19 on human capital (Hanushek & Woessmann, 2020). Human capital is cumulative – knowledge builds on knowledge – and missing out on education or other learning opportunities can have long-term consequences. The results of research suggest that, across the OECD, the impact of school closures due to COVID-19 is likely to lead to a loss of between 0.2% and 0.9% in human capital when all cohorts impacted have entered the labour force (de la Maisonneuve et al., 2022). Productivity losses due to this decrease in human capital are estimated to range between 0.4% and 2.1%, with the main impact being felt between 2030 and 2065. Although the time that students in Aotearoa New Zealand were out of school was shorter than in many other countries, policies aimed at improving the quality of education and adult training will be needed to offset, or at least alleviate, the impact of the pandemic on human capital.

Skills are becoming increasingly important. As technology advances, so do the skill requirements of those working with it. This “skill-biased technical change” will have differential implications across the labour market, as those with lower or older skills may find it harder to adjust (Card & Lemieux, 2001). A flexible labour market is vital to enable such adjustments to be made. It is important that workers can easily move between jobs and industries and not be unreasonably restricted from making needed changes in skills and technology. Government intervention may be required to support those negatively affected by the transition. This is one of the elements considered in our Future of work inquiry, discussed further in section 5.3 below.

To be successful, domestically or internationally, firms need access to motivated staff with relevant skills. Our Immigration settings inquiry (NZPC, 2022b) highlighted that, over time, Aotearoa New Zealand lost large numbers of skilled people through outward migration. This led to concerns about a “brain drain”. However, because the immigration system selects immigrants mostly on skill, immigrants are more likely to be tertiary educated than New Zealand-born residents, outnumbering tertiary-educated emigrants. This means immigration more than offsets the loss of skilled New Zealanders. In the last decade, immigration has reduced the risk of labour shortages for employers in diverse sectors of the economy – from aged care to the dairy industry and the IT sector.

Aotearoa New Zealand invests a great deal in the education and training of its people. It is important that these investments are focused in areas where they are needed, to minimise our reliance on migration as a source of skilled labour, and to ensure our investments are not wasted. This requires decisions about education and training to use information we obtain from the migration system about the skill needs of New Zealand firms. This information is valuable, as it is sourced from actual decisions made by employers to invest in bringing in staff. Our investigation suggests, however, that this flow of information and feedback is not occurring.

Currently, no consistent feedback mechanisms exist to link skills shortages evidence in the immigration system to potential responses in the education and training system. This limits the capacity of the education system to meet employer needs and weakens accountabilities on employers to train and develop local workers.

NZPC (2022), p. 6

The inquiry recommended several ways to address this issue, including regular Government Policy Statements which, among other things, describe how the Government will address the relationship between skill development and immigration.

Social cohesion

Socially beneficial norms, rules, culture, and understandings encourage inclusion and aid in the peaceful resolution of disputes, which allows society to focus on growth and development. For this reason, social cohesion can be understood to have a capital value. As an asset (or wealth) it creates ongoing benefits or value for New Zealand over time.

Fookes (2022), p. i

Market economies rely on trust and cohesion to function effectively (Knack & Keefer, 1997). Having a commonly accepted set of (often implicit) rules of behaviour, and a level of trust that others will engage under the same rules, streamlines market transactions. This “social contract” enables participants to engage in business and economic activity more efficiently.

Although difficult to measure, Aotearoa New Zealand’s social cohesion looks comparatively strong (Fookes, 2022), including the population’s trust in government (Figure 4.21). However, there are differences across groups within society, and we must recognise the unique challenges evident in combining the bicultural and multicultural dimensions of our nation (Gluckman et al., 2021). Generalised trust scores for Māori are around 10% lower than those for Pākehā, and reported discrimination is also higher for Māori and Pacific peoples.

Aotearoa New Zealand can be proud of the quality of its institutions and social capital. These institutions are vital in dealing with shocks, such as the COVID-19 pandemic (Barrett & Poot, 2023; Bollyky et al., 2022).38 However, as with any capital, evidence suggests that investment is required to maintain the value of these institutions. Although we currently have a level of relatively high trust in the institutions of government, it is very apparent from our experience during the pandemic that trust is not universal and can be eroded (Gluckman et al., 2021). As noted in our recent inquiry, A Fair Chance for All (NZPC, 2023a), the cycle of persistent disadvantage faced by many in New Zealand risks eroding the social contract relied upon by businesses and communities. Investments in breaking the cycle of persistent disadvantage can be seen as protecting or strengthening the social contract, which will provide long-term benefits to all, in terms of productivity and wellbeing.

The natural environment and environmental capital

As we noted in Part 2, mismeasured economic growth achieved through environmental depletion reduces the total capital available for future years and impacts on the wellbeing of future generations. This is more than an issue of measurement. If environmental capital is not priced or regulated to reflect its scarcity and importance, market production and consumption decisions will not take it into account, and firms will be incentivised to treat it as a free and endless resource. This has implications for current and future wellbeing – particularly in Aotearoa New Zealand, where large areas of our economy are based on the quality of the environment and its ability to support economic activity. For New Zealand, it is not a choice between “the economy or the environment” but a choice between the “the economy and the environment, or neither”.

Aotearoa New Zealand has among the highest per person greenhouse gas emissions in the world (NZPC, 2018b), even though most of our electricity comes from renewable sources. Two major emissions sources in the New Zealand economy are agriculture and transport. In our Low-emissions economy inquiry (NZPC, 2018b), we noted:

Effective emissions pricing provides a strong incentive to reduce emissions at least cost and provides a clear and credible signal to investors contemplating long-term investments in new production assets that have different emissions consequences.

NZPC (2018), p. 4

Higher emissions prices, increased coverage across the economy, and greater clarity about the future supply of emission permits are needed, to make the Emissions Trading Scheme more effective. We also made a range of recommendations in our Low-emissions inquiry, to support three key outcomes:

  • Transitioning from fossil fuels to electricity and other low-emissions fuels across the
  • Substantial levels of afforestation to offset Aotearoa New Zealand’s remaining This will require sustained rates of planting over the next 30 years (mostly on land currently used for sheep and beef farming).
  • Changes to the structure and methods of agricultural

Given the focus on investment and innovation in this report, perhaps the most relevant recommendation in our Low-emissions inquiry was that the Government should devote significantly more resources to low-emissions innovation than the modest current allocation. This is discussed further in section 5.2 below.

Financial, physical and intangible capital

For an advanced economy, Aotearoa New Zealand has low physical capital (that is, buildings, machinery, ICT and infrastructure) and invests only enough to maintain its level relative to others. It is not converging to the levels of other countries, as economic theory would suggest (all other things being equal). There are a range of potential reasons for this – from industry structure to the strength of domestic competition – which deserve further analysis. New Zealand has relatively small share markets and venture capital markets, and our firms face relatively high interest rates, and this may curtail investment.

Of particular concern is Aotearoa New Zealand’s low investment in research and development. We turn to this – and other elements of the innovation ecosystem – in the next section.

5.2 Innovation is the engine of growth

Innovation is an important determinant of productivity, and of long-term improvements in prosperity and wellbeing. Innovative products and services can fulfil unmet needs that are profound (such as new medical treatments) and mundane (the latest combination of chocolate with another childhood favourite lolly). Innovations in production methods and processes also underpin how we respond to climate change and environmental degradation.

Aotearoa New Zealand invests relatively little in research and development. There are both broad-based and focused approaches to find potential policy solutions to this issue. The benefit of a taking a broad-based approach is that the Government is not required to identify where innovation is occurring. Increasing the likelihood of investment for innovation across the board allows individuals and firms to identify areas of potential and make investments in them. The Government has introduced such a policy in the form of the Research and Development Tax Incentive (RDTI), which replaces the previous Growth Grant programme. In the recent Frontier Firms follow-on review inquiry (NZPC, 2023b), we noted that early teething problems appear to have been resolved with “more business-friendly guidance, greater familiarity with eligibility criteria, and in-year payment of the RDTI” (p. 25); that applications and submissions have risen, and the “profile of firms participating in the RDTI scheme is a reasonable match for relevant firms reporting R&D activity in Stats NZ’s Business R&D Survey” (ibid.). The report on the follow-on review also noted an increase in business R&D between 2016 and 2021 (although this also occurred in other OECD countries and was starting from a low base).

Both the initial Frontier Firms inquiry (NZPC, 2020a) and the follow-on review (NZPC 2023) state the importance of supplementing the broad-based approach of the RDTI with a focused and integrated innovation policy. Although some aspects of existing government processes and initiatives are promising, they lack key elements needed for successful focused innovation policy.

Box 9 The Research and Development Tax Incentive 

The Research and Development Tax Incentive (RDTI) provides a 15% tax incentive for eligible business research and development (R&D) activity incurring eligible expenditures. The scheme is administered jointly by:

  • Inland Revenue (which assesses the eligibility of business entities and expenditures, and approves tax incentives);
  • Callaghan Innovation (which advises Inland Revenue on the eligibility of R&D activity); and
  • the Ministry of Business, Innovation and Employment (which leads the design of policy and monitors the scheme in the context of wider research, science, and innovation policy).

Firms can apply for a General Approval in advance of undertaking R&D, which provides them with assurance that they will receive the incentive for their R&D activity, provided they continue to meet the eligibility requirements. General Approvals can be granted for up to three years. The Government is bringing in a system of “in-year” payments to help firms incurring the cost of R&D to better manage their cashflows.

Source: NZPC (2023).


Focused innovation policy is fundamental to lifting productivity

Our New Zealand Firms: Reaching for the frontier inquiry (NZPC, 2020a, 2023b) found that creating conditions for the most productive firms to emerge and flourish was a feasible and promising route to significantly improve Aotearoa New Zealand’s lacklustre productivity performance. Other small, advanced economies (such as the Netherlands, Denmark, Finland, Sweden, and Singapore) appear to have managed this, and provide examples that can be adapted to reflect New Zealand’s unique context. These countries have outstanding records of exporting specialised and distinctive goods and services at scale and have achieved world-leading advantages in selected markets. The follow-on review set out six ways in which innovation policy should be improved to enable New Zealand firms to better compete in these specialised markets (Figure 5.1). Fundamental to this approach is focusThe RDTI is a broad-based policy, and it needs to be accompanied by a focused set of activities that support areas of greatest potential.

The first recommendation was to not reinvent the wheel, but rather to use existing initiatives to choose focus areas. We recommended that government use the National Research Priority process to prioritise areas for focused innovation. Importantly, this should not be a top-down exercise led by government, but a collaboration with industry, researchers, iwi/Māori, and educators.

To balance focus and accountability with responsiveness and on-the-ground knowledge, the second recommendation was to establish two levels of governance: a high-level national council to provide strategic leadership and broad coordination; along with a devolved governance body for each focus area, with devolved funding and decision rights.

The third recommendation was to concentrate resources to enable government to commit significant, long-term funding to the focus areas. To make progress, material levels of investment are required. International experience indicates this should be in the order of $30 to $50 million a year for each focus area, matched by industry contributions. Decisions on how to allocate this funding should be devolved to governance bodies for each focus area, rather than being tied to specific government portfolios.

Aligning broader government and business efforts with the focus area was our fourth recommendation. Identifying a small number of specific focus areas would help government agencies improve policy alignment and reduce fragmentation. Policy settings across areas such as exporting, innovation, infrastructure, education and training, immigration, and regulation may all need to be improved, to support world-class innovation ecosystems in the focus areas.

Our fifth recommendation was to include iwi and Māori voices in decision making and leadership, to build flourishing innovation ecosystems and improve support for Māori business. Māori leadership is required both within and outside government. This recommendation called for ongoing efforts to build capacity and capability, and to adequately resource Māori contributions and leadership.

The final recommendation was to embed evaluation, to enable learning and adaption. Arrangements for monitoring and independent evaluation need to be built in from the outset, with dedicated funding. Measurement of results should focus on outcomes, and evaluation should be transparent and visible, with evaluation findings published as a matter of good practice.

Figure 5.1 Six recommendations for implementing focused innovation policy

Figure 5.1 Six recommendations for implementing focused innovation policy

5.3 It is important to smooth the process of reallocation by supporting workers

The Commission’s Technological change and the future of work inquiry (NZPC, 2019) focused on the impact of new technology on workers. In the inquiry, we noted that worker mobility and a dynamic labour market are vital for productivity, because they allow for the smooth and beneficial reallocation of resources to more productive firms. However, the closure of low-productivity firms and the associated loss of jobs can impact adversely on wellbeing, unless workers can move to other roles.

Research has found that the process by which resources are reallocated from poorer performing to better performing firms in Aotearoa New Zealand had an uneven impact on workers, with greater employment losses for low-wage workers, young workers and workers with short job tenure (Fabling & Maré, 2012). This result is surprising, given younger workers are likely to be more mobile than older workers, who may have greater ties to a particular region, and may be less likely to undertake retraining for new jobs.

Workers who are mobile and able to move jobs easily help facilitate reallocation. A voluntary move from one job to another is also an important way for workers to climb the job ladder and increase their earnings and job satisfaction. Changing jobs can be particularly beneficial for younger workers, as finding good matches for a person’s skills can have a large bearing on their career and future income.

Coleman & Zheng (2020) examined job-to-job transition across firms, industries and regions in Aotearoa New Zealand. They found that just over 20% of employees aged 18 to 64 (about 420,000 people) had a different job in March 2018 than they had a year earlier. Around 40% of these changes were to a new location, and nearly 60% involved switching industry, with only 20% staying in the same industry and location. They concluded that this implies New Zealand’s labour market is relatively dynamic. A dynamic labour market is beneficial now, and it could become even more important if productivity-enhancing technology changes at a faster rate in the future.

The Technological change and future of work inquiry (NZPC, 2019) concluded that Aotearoa New Zealand’s broad policy settings assist labour market dynamism by ensuring that access to healthcare, retirement savings and unemployment benefits is not linked to particular types of work arrangement, jobs or employers. However, income security, opportunities for development, career progression and social protections are also important for workers.

This consideration underpins our recommendations for greater income smoothing, and for increased access to training and labour-market programmes when people lose their jobs. Employment law should also be more effectively targeted (for example, by reviewing and updating the legal tests for employee status). All these measures are designed to increase resilience and opportunities for the workers of today and tomorrow (NZPC, 2019) (Box 10).

Box 10 Options for revising policy settings to better support workers

The Productivity Commission’s inquiry Technological change and the future of work (NZPC, 2019) highlighted measures that could improve income security for workers in Aotearoa New Zealand and promote dynamism in the economy, by reducing fears about job loss and facilitating better skills and labour-market matching.

The inquiry concluded there would be merit in policies that provide greater income smoothing for displaced workers, identifying three options.

  • Unemployment insurance
  • Portable individual redundancy accounts
  • Adjustments to current benefit and tax credit policies

Each of the above has benefits and drawbacks. Further analysis of fiscal costs, economic impacts and wellbeing effects is required.

Unemployment insurance would most likely provide income replacement at rates similar to those in most OECD countries in the immediate period following displacement. However, relatively minor adjustments to current benefit and tax credit policies could also substantially increase income replacement rates for those currently facing the largest falls in income.

Other options to consider include:

  • relating benefits to previous earnings and paying a higher fixed rate of payment for jobseekers for a limited period;
  • changing eligibility criteria to disregard partners’ income for a limited period;
  • creating a grace period for households whose total weekly working hours fall below the eligibility criteria for in-work and family tax credits; and creating new benefits or tax credits that apply for a limited period after job loss.

5.4 Improving the business of government

Strong policy foundations are crucial for boosting productivity. Successive governments have created institutions and implemented policies to tackle the productivity challenge. Some of these are broad, overarching policies that determine the macroeconomic environment, regulatory institutions and practices, and competition policy. Others are policies and institutional arrangements that govern particular institutions in science, innovation and education.

The performance of government in Aotearoa New Zealand is important. The public sector accounts for one-quarter of all employment in New Zealand. It is large and its output is difficult to measure. The services provided are critical, with many of these provided to the most vulnerable members of society. It also provides services to the rest of the economy: setting and maintaining regulations, enforcing the rule of law, providing and supporting physical and knowledge infrastructure, undertaking and funding research, supporting people in need, and building a healthy and educated workforce. It is imperative the business of government is undertaken effectively and efficiently. The cost of an ineffective or inefficient government is felt across society and the economy. These costs are not paid in lost shareholder value, but in lost opportunities, ill health, and low levels of wellbeing for the people they serve.

The business of government is hard. There are many reasons why it is more efficient or equitable for governments to provide services than to leave this to the innovation machine of the market. The key is to ensure the activities of government are directed to areas that can make the most positive (or least negative) impact, so new and innovative ways to support society and the economy are developed, tested, improved, and disseminated. In the absence of simple profitability or sales targets, other metrics must be developed. Monitoring and evaluation activities are crucial to determine whether things are going as planned, and whether those services benefit and deliver the right outcomes for those they are intended for.

The impact of public policies and government institutions on productivity is vitally important. It is necessary to evaluate the efficiency and effectiveness of specific interventions – not just to understand whether they work (in a simple, binary way), but rather to understand how they work and how their effectiveness depends on the context of their provision. Past investments in linked administrative and survey data, such as the Longitudinal Business Database (LBD) and the Integrated Data Infrastructure (IDI), have provided Aotearoa New Zealand with powerful tools to pursue these evaluations. These datasets capture the characteristics of firms and individuals before policies are even designed and can therefore help to account for the influence of selection effects – who is selected, and the impact this has on outcomes (Le & Jaffe, 2017; Morris & Stevens, 2010). Natural experiments, circumstances surrounding a programme, or evaluation criteria built into the design and implementation of policy and implementation, can result in clearer identification of the impacts of policies.

This information is crucial to underpin what the Commission calls a “learning system”. In our A fair chance for all inquiry (NZPC, 2023a), we concluded that, to be effective in supporting people to improve their wellbeing, the government needs a learning system that learns from the people it is trying to help and connects what is being learnt across all levels of government.

Such a learning system needs to:

  • understand what people need, and are able to do, to improve their wellbeing;
  • work alongside people to “learn by doing” in real time, to test different types of support and to get their input about how well these work;
  • regularly bring together what is being learnt from these individual interactions to identify common barriers that are preventing people getting the support they need (for example, not being able to apply for identification because there is no transport to take a person to get their photo taken, or lack of access to the internet to access digitally provided services); and
  • share what is being learnt with the rest of government to identify opportunities to remove system barriers, and to provide more effective support to people.

Investing in data infrastructure

Good policy requires good evidence, and good evidence requires good analysis and good data. Aotearoa New Zealand is fortunate in having access to two rich sources of evidence: the LBD and IDI. These datasets provide a unique asset for robustly examining the impact of government policy, without the need for expensive data collection. However, they require and warrant investment and maintenance, as they are fundamental to our understanding of the functioning of the economy for firms, individuals, and communities.

5.5 Concluding remarks

This document sheds light on the story of productivity for Aotearoa New Zealand. A productive New Zealand matters for our people’s material living standards and wellbeing, and its distribution across and within groups and communities. A productive economy enables investment in education, health, institutions, and infrastructure for our people. In turn, a well-educated and healthy population, working with knowledge and capital, is crucial for a productive economy.

Aotearoa New Zealand is blessed with a rich endowment of land, water, communities, and people. However, our historical approach to the use and protection of these resources raises concerns about their sustainability and the nature of the legacy we leave for future generations. We have a responsibility to those who follow us to preserve, protect and restore the natural and social capital that is a cornerstone of our wellbeing, waiora, and wairua.

Productivity provides an opportunity to better provide for the future at a lower cost to our people and resources of today. The evidence of recent decades shows New Zealanders are not lacking in their willingness to work – with both high employment rates and high average hours worked. However, although we are working harder, other countries have been benefiting from higher productivity – maintaining and improving material living standards, while also gaining more leisure time.

Growth in output production and improvements in productivity are two different things. To lift productivity, it is how we grow output production (in short, the inputs or resources we use in the process) that is critical. That is to address the productivity challenge, our understanding and insights indicate we need to shine the spotlight on the input side of the productivity equation. The common denominator is the need to commit to ongoing investments over the long term in the range of inputs or resources (that is, our endowments) currently under our watch, to ensure they are not only maintained better but are fit for purpose for Aotearoa New Zealand in the 21st century.

38 Although COVID-19 affected the entire population, deprived populations were affected disproportionately (Wiki et , 2021).

References

Abramovitz, M. (1956). Resource and output trends in the United States since 1870. The American Economic Review, 46(2), 5–23.

Acemoglu, D., & Robinson, J. A. (2012). Why nations fail: The origins of power, prosperity, and poverty. Crown. Acemoglu, D., & Zilibotti, F. (2001). Productivity differences. The Quarterly Journal of Economics, 116(2), 563–606.

Agarwal, R., Brown, P. J., Bajada, C., Stevens, P., & Green, R. (2020). The effects of competition on management practices in New Zealand–a study of manufacturing firms. International Journal of Production Research, 58(20), 6217–6234.

Aghion, P., & Griffith, R. (2008). Competition and growth: Reconciling theory and evidence. MIT Press.

Ahmad, N., & Koh, S.-H. (2011). Incorporating estimates of household production of non-market services into international comparisons of material well-being. OECD Publishing.

Akcigit, U., & Ates, S. T. (2019). What happened to U.S. business dynamism? (Working Paper No. 25756). National Bureau of Economic Research.

Akcigit, U., & Ates, S. T. (2021). Ten facts on declining business dynamism and lessons from endogenous growth theory. American Economic Journal: Macroeconomics, 13(1), 257–298.

Allan, C., & Maré, D. C. (2022). Who benefits from firm success? Heterogeneous rent-sharing in New Zealand (Motu Working Paper 22-03). Motu Economic and Public Policy Research.

Andersson, F., Burgess, S., & Lane, J. I. (2007). Cities, matching and the productivity gains of agglomeration. Journal of Urban Economics, 61(1), 112–128.

Andrews, D., & Criscuolo, C. (2019). The best versus the rest: Divergence across firms during the global productivity slowdown (Discussion Paper No. 1645). Centre for Economic Performance, LSE.

Australian Productivity Commission & New Zealand Productivity Commission (APC & NZPC). (2019). Growing the digital economy and maximising opportunities for SMEs (Joint Research by the Productivity Commissions of Australia and New Zealand). Productivity Commissions of Australia and New Zealand.

Asian Productivity Organization & OECD. (2021). Towards improved and comparable productivity statistics: A set of recommendations for statistical policy. OECD Publishing.

Autor, D., Dorn, D., Katz, L. F., Patterson, C., & Van Reenen, J. (2020). The fall of the labor share and the rise of superstar firms. The Quarterly Journal of Economics, 135(2), 645–709.

Autor, D. H., Levy, F., & Murnane, R. J. (2003). The skill content of recent technological change: An empirical exploration. The Quarterly Journal of Economics, 118(4), 1279–1333.

Barkai, S. (2020). Declining labor and capital shares. The Journal of Finance, 75(5), 2421–2463.

Barrett, P., & Poot, J. (2023). Islands, remoteness and effective policy making: Aotearoa New Zealand during the COVID-19 pandemic. Regional Science Policy & Practice, 15(3), 682–704.

Bassanini, A., & Caroli, E. (2015). Is work bad for health? The role of constraint versus choice. Annals of Economics and Statistics, 119/120, 13–37.

Battisti, M., Gatto, M. D., & Parmeter, C. F. (2022). Skill-biased technical change and labor market inefficiency. Journal of Economic Dynamics and Control, 139, 104428.

Baumol, W. J. (1993). Health care, education and the cost disease: A looming crisis for public choice. Public Choice, 77(1), 17–28.

Baumol, W. J. (1996). Children of performing arts, the economic dilemma: The climbing costs of health care and education. Journal of Cultural Economics, 20(3), 183–206.

Bedford, R., & Spoonley, P. (2014). Competing for talent: Diffusion of an innovation in New Zealand’s immigration policy. International Migration Review, 48(3), 891–911.

Berger, A. N., & Udell, G. F. (1998). The economics of small business finance: The roles of private equity and debt markets in the financial growth cycle. Journal of Banking & Finance, 22(6), 613–673.

Bertola, G., & Caballero, R. J. (1994). Cross-sectional efficiency and labour hoarding in a matching model of unemployment. The Review of Economic Studies, 61(3), 435–456.

Bertram, G., & Rosenberg, B. (2022, June). How policy and institutions affect the shares of wages, profit, and rent in New Zealand. [Presentation at the Annual Conference of the New Zealand Association of Economists, Wellington].

Birkinshaw, J., Hamel, G., & Mol, M. J. (2008). Management innovation. Academy of Management Review, 33(4), 825–845.

Bloom, N., Jones, C. I., Van Reenen, J., & Webb, M. (2020). Are ideas getting harder to find? American Economic Review, 110(4), 1104–1144.

Bloom, N., Sadun, R., & Reenen, J. V. (2012). Americans do IT better: US multinationals and the productivity miracle. American Economic Review, 102(1), 167–201.

Böckerman, P., & Ilmakunnas, P. (2012). The job satisfaction–productivity nexus: A study using matched survey and register data. ILR Review, 65(2), 244–262.

Bojke, C., Castelli, A., Grašič, K., & Street, A. (2017). Productivity growth in the English national health service from 1998/1999 to 2013/2014. Health Economics, 26(5), 547–565.

Bollyky, T. J., Angelino, O., Wigley, S., & Dieleman, J. L. (2022). Trust made the difference for democracies in COVID-19. The Lancet, 400(10353), 657.

Bolt, J., & Van Zanden, J. L. (2020). Maddison style estimates of the evolution of the world economy. A new 2020 update (Maddison-Project Working Paper WP-15). University of Groningen.

Boucekkine, R., de la Croix, D., & Licandro, O. (2011). Vintage capital growth theory: Three breakthroughs. In O. de la Grandville (Ed.), Economic growth and development (pp. 87–116). Emerald Group Publishing.

Bowman, J. (2022). Consequences of zombie businesses: Australia’s experience (Working Paper No. 23/2022). Centre for Applied Macroeconomic Analysis, Crawford School of Public Policy.

Brekke, K. A. (1997). Hicksian Income from resource extraction in an open economy. Land Economics, 73(4), 516–527.

Bresnahan, T. F., & Trajtenberg, M. (1995). General purpose technologies ‘Engines of growth’? Journal of Econometrics, 65(1), 83–108.

Bridgman, B., & Greenaway-McGrevy, R. (2018). The fall (and rise) of labour share in New Zealand. New Zealand Economic Papers, 52(2), 109–130.

Brynjolfsson, E., Rock, D., & Syverson, C. (2019). The Productivity J-Curve: How intangibles complement general purpose technologies (MIT Initiative on the Digital Economy Research Brief No. 19/02). Massachusetts Institute of Technology.

Brynjolfsson, E., Rock, D., & Syverson, C. (2021). The productivity J-Curve: How intangibles complement general purpose technologies. American Economic Journal: Macroeconomics, 13(1), 333–372.

Card, D., & Lemieux, T. (2001). Can falling supply explain the rising return to college for younger men? A cohort-based analysis. The Quarterly Journal of Economics, 116(2), 705–746.

Carver, T., & Grimes, A. (2016). Income or consumption: Which better predicts subjective wellbeing? (Motu Working Paper 16-12). Motu Economic and Public Policy Research.

Caselli, F., & Coleman, W. J. (2001). Cross-country technology diffusion: The case of computers. American Economic Review, 91(2), 328–335.

Castelli, A., Dawson, D., Gravelle, H., Jacobs, R., Kind, P., Loveridge, P., Martin, S., O’Mahony, M., Stevens, P. A., & Stokes, L. (2007). A new approach to measuring health system output and productivity. National Institute Economic Review, 200, 105–117.

Cerra, V., Lama, R., & Loayza, N. V. (2021). Links between growth, inequality, and poverty (Working Paper No. 2021/068). International Monetary Fund.

Chadeau, A. (1992). What is households’ non-market production worth. OECD Publishing.

Children’s Commissioner. (2018). The Child and Youth Wellbeing Strategy (Submission from the Office of the Children’s Commissioner).

Clark, A. E., & Oswald, A. J. (1994). Unhappiness and unemployment. The Economic Journal, 104(424), 648–659.

Coase, R. H. (1937). The nature of the firm. Economica, 4(16), 386–405.

Coe, D. T., & Helpman, E. (1995). International R&D spillovers. European Economic Review, 39(5), 859–887. Coe, D. T., Helpman, E., & Hoffmaister, A. W. (1997). North-south R&D spillovers. The Economic Journal, 107(440), 134–149.

Cohen, W. M., & Levinthal, D. A. (1989). Innovation and learning: The two faces of R&D. The Economic Journal,    99(397), 569–596.

Coleman, A., & Zheng, G. (2020). Job-to-job transitions and the regional job ladder. New Zealand Productivity Commission.

Conway, P., Meehan, L., & Parham, D. (2015). Who benefits from productivity growth? The labour income share in New Zealand (NZPC Working Paper No. 2015/1.

Corrado, C., Haskel, J., Jona-Lasinio, C., & Iommi, M. (2022). Intangible capital and modern economies. Journal of Economic Perspectives, 36(3), 3–28.

Crawford, R., Fabling, R., Grimes, A., & Bonner, N. (2007). National R&D and patenting: Is New Zealand an outlier? New Zealand Economic Papers, 41(1), 69–90.

Davies, L., Webber, A., & Timmins, J. (2022). The nature of disadvantage. Faced by children in New Zealand: Implications for policy and service provision. Policy Quarterly, 18(3), 38–43.

de la Maisonneuve, C., Égert, B., & Turner, D. (2022). Quantifying the macroeconomic impact of COVID-19- related school closures through the human capital channel (No. 1729, OECD Economics Department Working Papers). OECD Publishing.

De Loecker, J., Eeckhout, J., & Unger, G. (2020). The rise of market power and the macroeconomic implications. The Quarterly Journal of Economics, 135(2), 561–644.

Deaton, A. (2008). Income, health, and well-being around the world: Evidence from the Gallup World Poll. Journal of Economic Perspectives, 22(2), 53–72.

Diewert, E., & Lawrence, D. (1999). Measuring New Zealand’s productivity (Working Paper No. 99/05). The Treasury.

Dollar, D., Kleineberg, T., & Kraay, A. (2015). Growth, inequality and social welfare: Cross-country evidence. Economic Policy, 30(82), 335–377.

Dollar, D., & Kraay, A. (2002). Growth is good for the poor. Journal of Economic Growth, 7(3), 195–225.

Eaton, J., & Kortum, S. (1999). International technology diffusion: Theory and measurement. International Economic Review, 40(3), 537–570.

Erez, A., & Isen, A. M. (2002). The influence of positive affect on the components of expectancy motivation. Journal of Applied Psychology, 87, 1055–1067.

Fabling, R. (forthcoming). Working hard or hardly working: Testing for bias in the labour input series. New Zealand Productivity Commission.

Fabling, R., & Grimes, A. (2007). Practice makes profit: Business practices and firm success. Small Business Economics, 29(4), 383–399.

Fabling, R., & Grimes, A. (2010). HR practices and New Zealand firm performance: What matters and who does it? The International Journal of Human Resource Management, 21(4), 488–508.

Fabling, R., & Grimes, A. (2014). The “suite” smell of success: Personnel practices and firm performance. ILR Review, 67(4), 1095–1126.

Fabling, R., & Maré, D. (2012). Cyclical labour market adjustment in New Zealand: The response of firms to the global financial crisis and its implications for workers. (Motu Working Paper 12-04). Motu Economic and Public Policy Research.

Fabling, R., & Sanderson, L. (2013). Exporting and firm performance: Market entry, investment and expansion. Journal of International Economics, 89(2), 422–431.

Fabling, R., & Sanderson, L. (2015). Exchange rate fluctuations and the margins of exports. (Motu Working Paper 15-05). Motu Economic and Public Policy Research.

Feenstra, R. C., Inklaar, R., & Timmer, M. P. (2015). The next generation of the Penn World Table. American Economic Review, 105(10), 3150–3182.

Fenn, G. W., Liang, N., & Prowse, S. (1997). The private equity market: An overview. Financial Markets, Institutions & Instruments, 6(4), 1–106.

Fitchett, H., & Jacob, P. (2022). How do we stack up?: The New Zealand housing market in the international context (Analytical Notes AN2022/06). Reserve Bank of New Zealand | Te Pūtea Matua.

Flatau, P., Galea, J., & Petridis, R. (2000). Mental health and wellbeing and unemployment. Australian Economic Review, 33(2), 161–181.

Foliaki, S. (2001). Pacific mental health services and workforce: Moving on the Blueprint. Mental Health Commission.

Fookes, C. (2022). Social Cohesion in New Zealand: Background paper to Te Tai Waiora: Wellbeing in Aotearoa New Zealand 2022 (Analytical Paper No. 22/01). The Treasury.

Fraser, H. (2018). The labour income share in New Zealand: An update (Research Note No. 2018/1). New Zealand Productivity Commission.

Gemmell, N., Nolan, P., & Scobie, G. (2017). Public sector productivity: Quality adjusting sector-level data on New Zealand schools (Working Paper No. 2017/2). New Zealand Productivity Commission.

Gemmell, N., Nolan, P., & Scobie, G. (2018). Quality adjusting education sector productivity. Policy Quarterly, 14(3), 46–51.

Gluckman, P., Bardsley, A., Spoonley, P., Royal, C., Simon-Kumar, N., & Chen, A. (2021). Sustaining Aotearoa New Zealand as a cohesive society. Koi Tū: The Centre for Informed Futures.

Gordon, R. J. (2018). Why has economic growth slowed when innovation appears to be accelerating? (Working Paper No. 24554). National Bureau of Economic Research.

Graunt, J. (1676). Natural and political observations made upon the bills of mortality. John Martyn.

Green, R., & Agarwal, R. (2011). Management matters in New Zealand: How does manufacturing measure up? Ministry of Economic Development New Zealand.

Greenaway, D., & Kneller, R. (2007). Firm heterogeneity, exporting and foreign direct investment. The Economic Journal, 117(517), F134–F161.

Greenwood, J., & Jovanovic, B. (1990). Financial development, growth, and the distribution of income. Journal of Political Economy, 98(5, Part 1), 1076–1107.

Griffith, R., Redding, S., & Reenen, J. V. (2004). Mapping the two faces of R&D: Productivity growth in a panel of OECD industries. Review of Economics and Statistics, 86(4), 883–895.

Grimes, A., & Wu, S. (2022). Sustainable consumption growth: New Zealand’s surprising performance. New Zealand Economic Papers, (2022, October 26), 1–15.

Gromada, A., Rees, G., & Chzhen, Y. (2020). Worlds of influence: Understanding what shapes child well-being in rich countries (Innocenti Report Card 16). UNICEF.

Grossman, G. M., & Helpman, E. (1990). Trade, innovation, and growth. The American Economic Review, 80(2), 86–91.

Grossman, G. M., & Helpman, E. (1991). Quality ladders in the theory of growth. The Review of Economic Studies, 58(1), 43–61.

Grossman, G. M., & Oberfield, E. (2022). The elusive explanation for the declining labor share. Annual Review of Economics, 14(1), 93–124.

Hall, B. H., & Khan, B. (2003). Adoption of new technology. National Bureau of Economic Research. Hanushek, E. A., & Woessmann, L. (2020). The economic impacts of learning losses. OECD Publishing.

Hanushek, E., & Woessmann, L. (2010). The high cost of low educational performance: The long-run economic impact of improving PISA outcomes. OECD.

Hartmann, D., Guevara, M. R., Jara-Figueroa, C., Aristarán, M., & Hidalgo, C. A. (2017). Linking economic complexity, institutions, and income inequality. World Development, 93, 75–93.

Hausmann, R., Hidalgo, C. A., Bustos, S., Coscia, M., & Simoes, A. (2014). The atlas of economic complexity: Mapping paths to prosperity. MIT Press.

Hausmann, R., Hwang, J., & Rodrik, D. (2007). What you export matters. Journal of Economic Growth, 12, 1–25.

Hellmann, T., & Puri, M. (2000). The interaction between product market and financing strategy: The role of venture capital. The Review of Financial Studies, 13(4), 959–984.

Helpman, E. (1984). A simple theory of international trade with multinational corporations. Journal of Political Economy, 92(3), 451–471.

Helpman, E., & Krugman, P. R. (1987). Market structure and foreign trade: Increasing return, imperfect competition, and the international economy (Reprint edition). MIT Press.

Hicks, J. R. (1946). Value and capital. Oxford University Press.

Hidalgo, C. (2015). Why information grows: The evolution of order, from atoms to economies. Basic Books.

Hidalgo, C. A., Klinger, B., Barabási, A.-L., & Hausmann, R. (2007). The product space conditions the development of nations. Science, 317(5837), 482–487.

Horstmann, I. J., & Markusen, J. R. (1987). Strategic investments and the development of multinationals. International Economic Review, 28(1), 109–121.

Horstmann, I. J., & Markusen, J. R. (1992). Endogenous market structures in international trade (natura facit saltum). Journal of International Economics, 32(1–2), 109–129.

Howitt, P. (2010). Endogenous growth theory. In S. N. Durlaug & L. E. Bloom (Eds.), Economic growth. The New Palgrave economics collection (pp. 68–73). Palgrave Macmillan.

Hoynes, H., Miller, D. L., & Schaller, J. (2012). Who suffers during recessions? Journal of Economic Perspectives, 26(3), 27–48.

Hughes, T., Cardona, D., & Armstrong, C. (2022). Trends in wellbeing in Aotearoa New Zealand: 2000–2020 [Background Paper for the 2022 Wellbeing Report]. The Treasury.

Hulten, C. R. (2007). Total factor productivity: A short biography. In C. R. Hulten, E. R. Dean, & M. Harper (Eds.), New developments in productivity analysis (pp. 1–54). University of Chicago Press.

Ifcher, J., & Zarghamee, H. (2011). Happiness and time preference: The effect of positive affect in a random- assignment experiment. American Economic Review, 101(7), 3109–3129.

Inklaar, R., Woltjer, P., Albarrán, D. G., & Gallardo, D. (2019). The composition of capital and cross-country productivity comparisons. International Productivity Monitor, 36, 34–52.

Isen, A. M. (2008). Some ways in which positive affect influences decision making and problem solving. In M. Lewis & J. M. Haviland-Jones (Eds.), Handbook of emotions (3rd Edition) (pp. 548–573). The Guilford Press.

Isen, A. M., & Geva, N. (1987). The influence of positive affect on acceptable level of risk: The person with a large canoe has a large worry. Organizational Behavior and Human Decision Processes, 39(2), 145–154.

Jagger, D., & Stevens, P. (2019). He Whakaaro: Accounting for educational disadvantage [He Whakaaro Education Insights]. Ministry of Education.

Janssen, J., Galt, M., & Bollinger, G. (2022). New Zealand’s productivity performance: Taking a broader view (Analytical Note No. 22/05). The Treasury.

Johansen, L. (1959). Substitution versus fixed production coefficients in the theory of economic growth: A synthesis. Econometrica: Journal of the Econometric Society, 27(2), 157–176.

Johnson, A. (2023, March 30). Which jobs will AI replace? These 4 industries will be heavily impacted. Forbes. Karabarbounis, L., & Neiman, B. (2014). The global decline of the labor share. The Quarterly Journal of Economics, 129(1), 61–103.

Karabarbounis, L., & Neiman, B. (2019). Accounting for factorless income. NBER Macroeconomics Annual, 33, 167–228.

Keller, W. (2002). Geographic localization of international technology diffusion. American Economic Review, 92(1), 120–142.

Keller, W. (2004). International technology diffusion. Journal of Economic Literature, 42(3), 752–782. Keynes, J. M. (1936). The General Theory of Employment, Interest and Money. Macmillan & Co.

Kirchsteiger, G., Rigotti, L., & Rustichini, A. (2006). Your morals might be your moods. Journal of Economic Behavior & Organization, 59(2), 155–172.

Knack, S., & Keefer, P. (1997). Does social capital have an economic payoff? A cross-country investigation. The Quarterly Journal of Economics, 112(4), 1251–1288.

Kneller, R., & Stevens, P. A. (2006). Frontier technology and absorptive capacity: Evidence from OECD manufacturing industries. Oxford Bulletin of Economics and Statistics, 68(1), 1–21.

Kuznets, S. (1934). National income, 1929-1932. In S. Kuznets, National income, 1929-1932 (pp. 1–12). National Bureau of Economic Research.

Lattimore, R. G., & Hawke, G. (1999). Visionaries, farmers and markets: An economic history of New Zealand agriculture (No. 12830). AgEcon Search.

Layard, P., & Layard, R. (2011). Happiness: Lessons from a new science. Penguin UK.

Layard, R. (2006). Happiness and public policy: A challenge to the profession. The Economic Journal, 116(510), C24–C33.

Le, T., & Jaffe, A. B. (2017). The impact of R&D subsidy on innovation: Evidence from New Zealand firms. Economics of Innovation and New Technology, 26(5), 429–452.

Lepenies, P., & Gaines, J. (2016). The power of a single number: A political history of GDP. Columbia University Press.

Levine, R. (2005). Finance and growth: Theory and evidence. Handbook of Economic Growth, 1(A), 865–934.

Levine, R., & Zervos, S. (1998). Stock markets, banks, and economic growth. The American Economic Review, 88(3), 537–558.

Liu, B., Chen, H., & Gan, X. (2019). How much is too much? The influence of work hours on social development: An empirical analysis for OECD countries. International Journal of Environmental Research and Public Health, 16(24), 4914.

Lucas, R. E. (1988). On the mechanics of economic development. Journal of Monetary Economics, 22(1), 3–42.

Lucas, R. E., Jr. (2015). Human capital and growth. American Economic Review, 105(5), 85–88.

Maré, D. C., & Graham, D. J. (2013). Agglomeration elasticities and firm heterogeneity. Journal of Urban Economics, 75, 44–56.

Maré, D. C., Hyslop, D. R., & Fabling, R. (2017). Firm productivity growth and skill. New Zealand Economic Papers, 51(3), 302-326.                                                                                                                                               

Maré, D. C., Le, T., Fabling, R., & Chappell, N. (2017). Productivity and the allocation of skills (Motu Working Paper 17-04). Motu Economic and Public Policy Research.

Maré, D. C., Morton, M., & Sanderson, L. (forthcoming). Missing migrants: Border closures as a labour supply shock. Motu Economic and Public Policy Research.

Markusen, J. R. (1984). Multinationals, multi-plant economies, and the gains from trade. Journal of International Economics, 16(3–4), 205–226.

Markusen, J. R., & Venables, A. J. (1998). Multinational firms and the new trade theory. Journal of International Economics, 46(2), 183–203.

Markusen, J. R., & Venables, A. J. (2000). The theory of endowment, intra-industry and multi-national trade. Journal of International Economics, 52(2), 209–234.

Mason, G., & Osborne, M. (2007). Productivity, capital-intensity and labour quality at sector level in New Zealand and the UK (Working Paper No. 07/01). The Treasury.

McCann, P. (2009). Economic geography, globalisation and New Zealand’s productivity paradox. New Zealand Economic Papers, 43(3), 279–314.

McGowan, M. A., Andrews, D., & Millot, V. (2017). The walking dead?: Zombie firms and productivity performance in OECD countries (Working Paper No. 1372). OECD.

McNaughton, T. (2008). Adjusting for changes in labour composition in Statistics New Zealand’s Productivity Series. Labour, Employment and Work in New Zealand (2008), 420–423.

Mincer, J. (1984). Human capital and economic growth. Economics of Education Review, 3(3), 195–205.

Morris, M., & Stevens, P. (2010). Evaluation of a New Zealand business support programme using firm performance micro-data. Small Enterprise Research, 17(1), 30–42.

Moughan, P. J. (20 1). Floreat Scientia: Celebrating New Zealand’s agrifood innovation (1st Edition). Wairau Press.

Myers, M. (2009). The impact of the economic downturn on productivity growth. Economic & Labour Market Review, 3, 18–25.

New Zealand Infrastructure Commission. (2021). Investment gap or efficiency gap? Benchmarking New Zealand’s investment in infrastructure (Te Waihanga Research Insights Series).

New Zealand Infrastructure Commission. (2022a). The decline of housing supply in New Zealand: Why it happened and how to reverse it. (Te Waihanga Research Insights Series.).

New Zealand Infrastructure Commission. (2022b). The lay of the land: Benchmarking New Zealand’s infrastructure delivery costs (Te Waihanga Research Insights Series).

Nordhaus, W. D., & Tobin, J. (1973). Is growth obsolete? In M. Moss (Ed.), The measurement of economic and social performance (pp. 509–564). National Bureau of Economic Research.

North, D. C. (1991). Institutions. Journal of Economic Perspectives, 5(1), 97–112. Nussbaum, M. C. (2011). Creating capabilities. Harvard University Press.

Nussbaum, M. C., & Sen, A. (Eds.). (1993). The quality of life. Clarendon Press Oxford.

New Zealand Productivity Commission (NZPC). (2018a). Improving state sector productivity [Final Report]. NZPC. (2018b). Low-emissions economy [Final report].

NZPC. (2019). Technological change and the future of work [Issues paper]. NZPC. (2020a). New Zealand firms: Reaching for the frontier [Draft report].

NZPC. (2020b). Technological change and the future of work [Final Report].                                                                                                                                                                                                                                NZPC. (2021a). New Zealand Firms: Reaching for the frontier [Final Report]. NZPC. (2021b). Productivity by the numbers.

NZPC. (2022a). Immigration by the numbers.

NZPC. (2022b). Immigration — Fit for the future [Final Report]. NZPC. (2023a). A fair chance for all [Final report].

NZPC. (2023b). Frontier Firms: Follow-on review [Final Report].

Organisation for Economic Co-operation and Development (OECD). (2015). The future of productivity. OECD Publishing.

OECD. (2017a). International trade, foreign direct investment and global value chains [New Zealand Trade and Investment Statistical Note]. OECD Publishing.

OECD. (2017b). OECD Economic Surveys: New Zealand 2017.

OECD. (2017c). OECD science, technology and industry scoreboard 2017: The digital transformation. OECD Publishing.

OECD. (2018). Equity in education: Breaking down barriers to social mobility. OECD Publishing.

OECD. (2022a). Identifying the main drivers of productivity growth: A literature review. OECD Publishing. OECD. (2022b). OECD Economic Surveys: New Zealand 2022 [Overview].

Oi, W. Y. (1962). Labor as a quasi-fixed factor. Journal of Political Economy, 70(6), 538–555.

O’Mahony, M., & Stevens, P. (2006). International comparisons of output and productivity in public service provision: A review. In G. A. Boyne, K. J. Meier, L. J. O’Toole Jr., & R. M. Walker (Eds.), Public service performance: Perspectives on measurement and management (pp. 233–253). Cambridge University Press.

Oswald, A. J., Proto, E., & Sgroi, D. (2015). Happiness and productivity. Journal of Labor Economics, 33(4), 789–822.

Parente, S. L., & Prescott, E. C. (1994). Barriers to technology adoption and development. Journal of Political Economy, 102(2), 298–321.

Partridge, R., & Wilkinson, B. (2019). Work in progress: Why Fair Pay Agreements would be bad for labour. The New Zealand Initiative.

Pearce, D. W., & Atkinson, G. (1995). Measuring sustainable development. In D. Bromley (Ed.), The handbook of environmental economics (pp. 166–181). Blackwell.

Pells, S. (2018). How useful are our productivity measures? Literature review. Ministry of Business, Innovation and Employment.

Pelosi, M., Rodano, G., & Sette, E. (2021). Zombie firms and the take-up of support measures during Covid-19 (Occasional Papers No. 650). Bank of Italy, Economic Research and International Relations Area.

Pencavel, J. (2015). The productivity of working hours. The Economic Journal, 125(589), 2052–2076. Piketty, T. (2018). Capital in the twenty-first century. Harvard University Press.

Prescott, E. C. (1998). Lawrence R. Klein lecture 1997: Needed: A theory of total factor productivity. International Economic Review, 39(3), 525–551.

Reddell, M. (2017, August 29). Labour share of income. Croaking Cassandra.

Riekhoff, A.-J., Krutova, O., & Nätti, J. (2019). Working-hour trends in the Nordic countries: Convergence or divergence? Nordic Journal of Working Life Studies, 9(3), 45-70.                                                                           

Riggs, L. (Forthcoming). Multi-dimensional disadvantage and wellbeing [Working Paper]. New Zealand Productivity Commission.

Riggs, L., Keall, M., Howden-Chapman, P., & Baker, M. G. (2021). Environmental burden of disease from unsafe and substandard housing, New Zealand, 2010–2017. Bulletin of the World Health Organization, 99(4), 259–270.

Robbins, C. A. (2016). Using new growth theory to sharpen the focus on people and places in innovation measurement. Blue Sky Forum, Informing science innovation policies, towards the next generation of data and indicators.

Romer, P. M. (1990). Endogenous technological change. Journal of Political Economy, 98(5, Part 2), S71–S102.

Rosenberg, B. (2017). A brief history of labour’s share of income in New Zealand 1939–2016. In G. Anderson, A. Geare, E. Rasmussen, & M. Wilson (Eds.), Transforming workplace relations in New Zealand 1976-–016 (pp. 79–106). Victoria University Press.

Rosenberg, N. (1972). Factors affecting the diffusion of technology. Explorations in Economic History, 10(1), 3–33.

Sanderson, L. (2022). The evolution of management practices in New Zealand (Chief Economist Unit Working Paper No. 22/03). Ministry of Business, Innovation and Employment.

Schneider, T., Hong, G. H., & Van Le, A. (2018). Japan: Land of the rising robots. Finance & Development, 55(002), 28–21.

Schreyer, P., & Pilat, D. (2001). Measuring productivity. OECD Economic Studies, 33(2), 127–170. Schumpeter, J. A. (1942). Capitalism, socialism and democracy. Harper & Brothers.

Scott, D. (2020). Education and earnings: A New Zealand update. Ministry of Education.

Scur, D., Sadun, R., Van Reenen, J., Lemos, R., & Bloom, N. (2021). The World Management Survey at 18: Lessons and the way forward. Oxford Review of Economic Policy, 37(2), 231–258.

Sen, A. (1985). Commodities and capabilities. North-Holland.

Sen, A. (2003). Development as capability expansion. In S. Fukuda-Parr & A. Shiva Kumar (Eds.), Human development (pp. 3–16). Oxford University Press.

Simpson, H. (2009). Productivity in public services. Journal of Economic Surveys, 23(2), 250–276.

Sin, I., Fabling, R., Jaffe, A. B., Maré, D. C., & Sanderson, L. (2014). Exporting, innovation and the role of immigrants (Motu Working Paper 14-15). Motu Economic and Public Policy Research.

Solow, R. M. (2000). Notes on social capital and economic performance. In P. Dasgupta & I. Serageldin (Eds.), Social Capital: A Multifaceted Perspective (pp. 6–10). World Bank.

Stansbury, A., & Summers, L. (2020). The declining worker power hypothesis: An explanation for the recent evolution of the American economy [NBER Working Paper No. 27193]. National Bureau of Economic Research.

Stats NZ. (2020, September 7). Four in 10 employed New Zealanders work from home during lockdown [Media Release].

Stats NZ. (2022, October 27). New Zealand business demography statistics: At February 2022 [Information release].

Stats NZ. (2023, March). Productivity statistics: 1978–2022.

Stevens, P. (2006). Public sector performance: Introduction. National Institute Economic Review, 197, 65–66.                                                                                                                                                                 

Stevens, P. (2007). Skill shortages and firms’ employment behaviour. Labour Economics, 14(2), 231–249.

Stevens, P. (2011). Innovation and the modern economy: An economist’s perspective. In Moughan, P. J., McCool, P., & Riddet Institute (Eds.), Floreat Scientia: Celebrating New Zealand’s agrifood innovation (pp. 17–22). Wairau Press.

Stevens, P., Stokes, L., & O’Mahony, M. (2006). Metrics, targets and performance. National Institute Economic Review, 197, 80–92.

Studenski, P. (1958). The income of nations: Theory, measurement, and analysis: Past and present; A study in applied economics and statistics (Vol. 1). New York University Press.

Summers, L. (2016). Secular stagnation and monetary policy. Federal Reserve Bank of St. Louis Review, 98(2), 93–110.

The Treasury. (2021). The Living Standards Framework 2021.

The Treasury. (2022). Te Tai Waiora: Wellbeing in Aotearoa New Zealand 2022.

Tipper, A. (2013). Output and productivity in the education and health industries. [Paper presented at the 54th New Zealand Association of Economists Conference, Wellington, New Zealand]. Stats NZ.

Triplett, J. E. (2001). What’s different about health? Human repair and car repair in national accounts and in national health accounts. In D. M. Cutler & E. R. Berndt (Eds.) Medical care output and productivity (pp. 15–96). University of Chicago Press.

Ward, A., Zinni, M. B., & Marianna, P. (2018). International productivity gaps: Are labour input measures comparable? (Working Paper No. 99; p. OECD). OECD Publishing.

Waring, M. (2018). Still counting: Wellbeing, women’s work and policy-making. Bridget Williams Books. Waring, M., & Steinem, G. (1988). If women counted: A new feminist economics. Harper & Row.

Wiki, J., Marek, L., Hobbs, M., Kingham, S., & Campbell, M. (2021). Understanding vulnerability to COVID-19 in New Zealand: A nationwide cross-sectional study. Journal of the Royal Society of New Zealand, 51(sup1), S179–S196.

Winkelmann, L., & Winkelmann, R. (1998). Why are the unemployed so unhappy? Evidence from panel data. Economica, 65(257), 1–15.

World Bank. (20 1). The changing wealth of nations: Measuring sustainable development in the new millennium. Xu, B. (2000). Multinational enterprises, technology diffusion, and host country productivity growth. Journal of Development Economics, 62(2), 477–493.

Yeung, J. W., Zhang, Z., & Kim, T. Y. (2018). Volunteering and health benefits in general adults: Cumulative effects and forms. BMC Public Health, 18(1), 1–8.

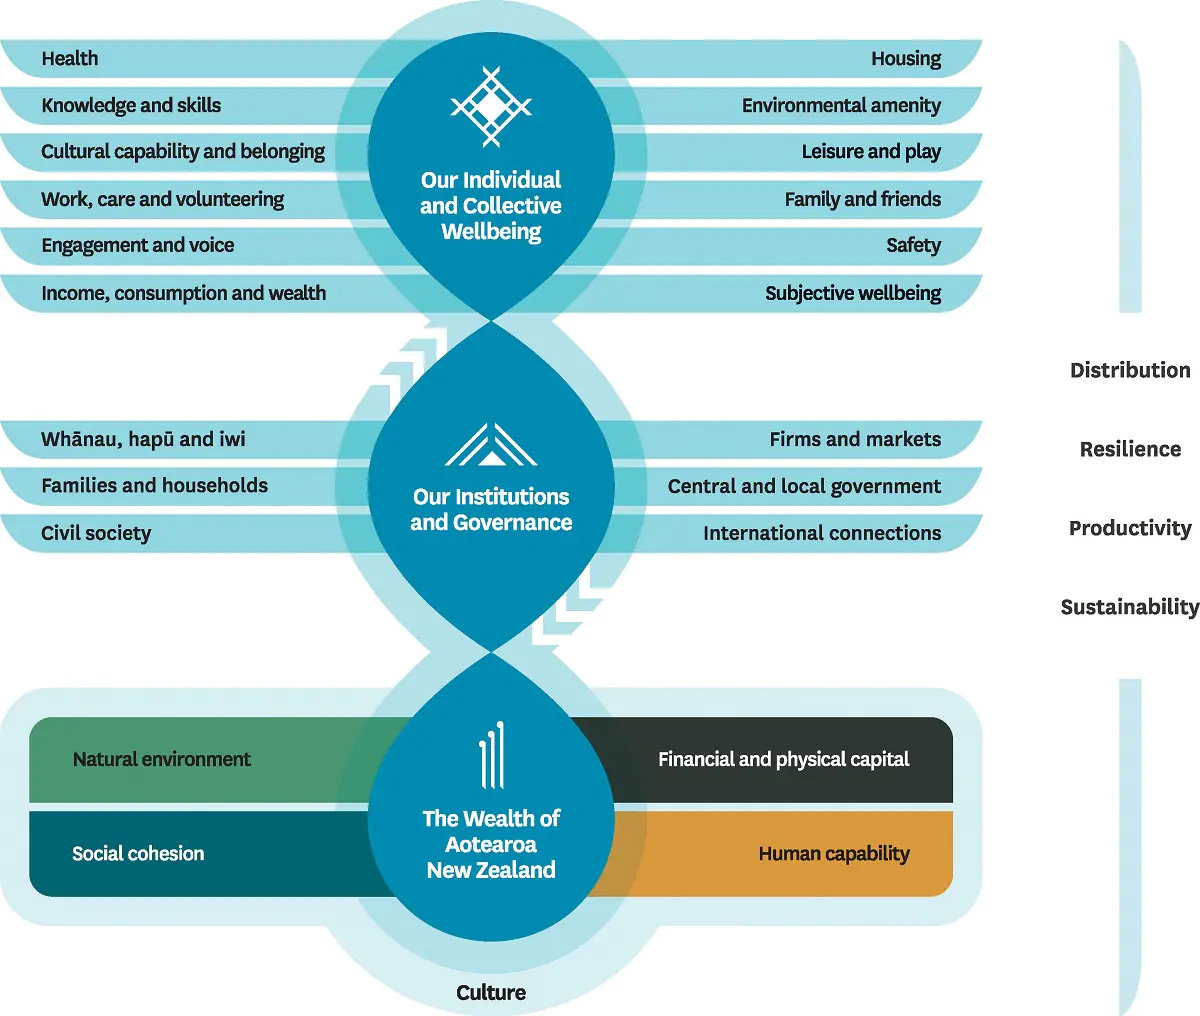
Appendix: The components of productivity

Appendix: The components of productivity

Productivity is simply what you get out for what you put in. It is made up of economies of scale, economies of scope, technical efficiency, allocative efficiency, and technology or knowledge. True productivity can differ from measured productivity, due to measurement, which is another important component of productivity.
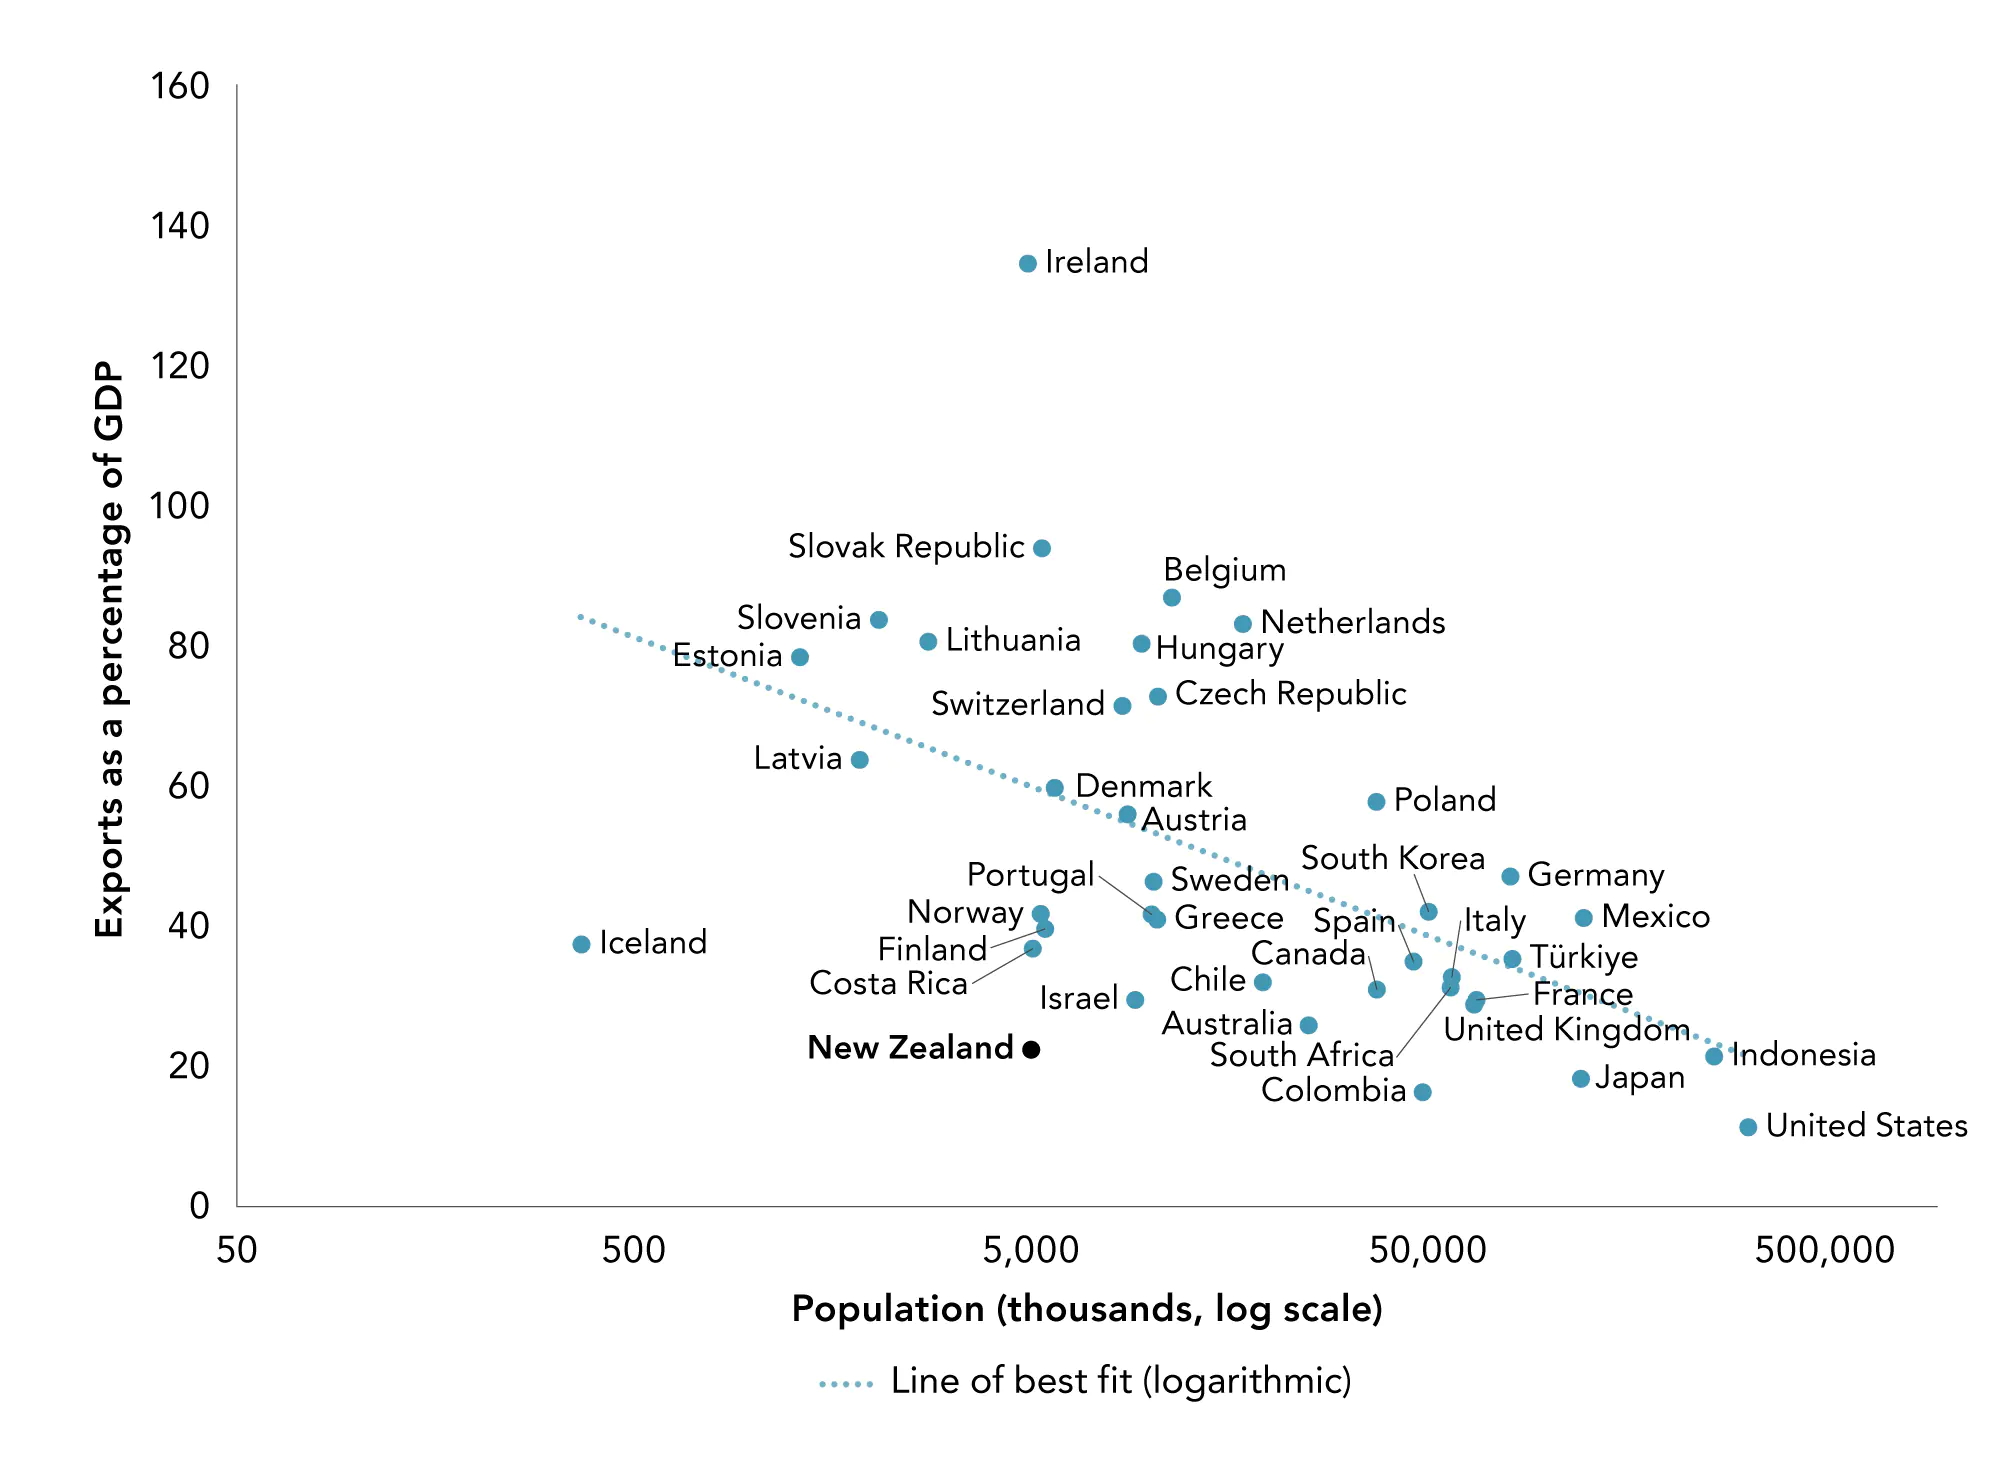
All these phenomena can operate at any level of the economy: the individual task or person, branches or plants within companies, firms, regions, countries, and the whole world. For example, cities benefit from economies of scale, through deeper labour markets and hence better matching of the skills of workers to the needs of employers. Firms also benefit from economies of scale, as fixed inputs can be shared across a larger number of workers or customers, reducing their average cost.

Economies of scale

Economies of scale are the benefits of size in economic activity. Larger firms can share fixed costs across a broad range of activities: one machine can be shared across many workers; buying power can push down purchasing or transport costs. Small business owners often must be HR, marketing, accounting and production managers. Few people are highly skilled in all these areas, and switching from one task to another can take time and mental effort. On the other side, there can be diseconomies of scale, as an organisation becomes unwieldy or multiple layers of management stifle innovation and increase the distance between leadership and staff.                                                                                                                                                                           

Economies of scale are generally divided into internal and external economies.

Internal economies of scale include the following.

  • Financial As firms get larger, it becomes easier to seek investment and the cost of borrowing decreases, as larger firms are seen as more reliable.
  • Purchasing Larger firms require more raw materials and can get discounts from buying in large quantities.
  • Marketing The cost of advertising per unit of output decreases, as advertising is a fixed cost.
  • Technical Larger firms can invest in more efficient machinery and technology.
  • Managerial As firms get larger, they are more able to attract skilled managers.
  • Risk-bearing Larger firms are more likely and able to produce a variety of products, reducing risk, as they are not dependent on the sale of one product.

External economies of scale include the following.

  • Skilled When activity is concentrated in an area, it can attract skilled workers around that location. This makes it easier for firms to recruit new workers and reduces the training costs they might otherwise incur.
  • As an industry grows in an area, suppliers of raw materials and services for that industry are likely to be set up nearby, due to the abundance of demand. This will reduce the transport cost of raw materials and lead to more and higher-quality services provided by firms.
  • Investment in infrastructure around concentrated locations of activity is likely to be tailored to the needs of that industry.
  • As an industry grows in an area, similar or related firms may find it beneficial to cooperate with each other and share resources.

Economies of scope

Economies of scope arise when there are benefits to producing multiple goods or services in tandem. In some cases, by-products that might be seen as waste and incur a cost of disposal become products, or an input to other processes (for example, biofuels or tallow from beef production).

Technical efficiency

Technical efficiency refers to the effectiveness with which inputs are turned into outputs, relative to what is currently possible. Technical efficiency can be measured from the perspective of inputs: is the firm, industry or country using the least amount of input to produce its outputs (“input-orientated technical efficiency”)? Alternatively, we can ask the question from an output orientation: is the firm, industry or country producing the maximum output it could feasibly produce, given the inputs it is using?

Allocative efficiency

Allocative efficiency refers to using the combination of inputs or outputs that maximise overall wellbeing. For example, if both surgery and a course of drugs have the same impact on health outcomes, but the former has a higher cost, overall wellbeing could be maximised by shifting provision from surgery to drugs, as the cost savings could be spent on additional health services (or a holiday).                                                                                   

Technology and knowledge

The greatest of all influences on productivity and material wellbeing is the level of technology and knowledge.

That humanity has enjoyed a phenomenal improvement in its material wellbeing is not due to us getting out of bed earlier in the morning or working longer hours than our forebears; it is due to innovation. The means whereby new things to do and new ways of doing them are created, dispersed, adopted are – and will continue to be – a key determinant of the wellbeing of New Zealanders.

Stevens, 2011, p. 22

Mismeasurement

As productivity cannot be explained by observed inputs, empirical estimates of productivity include elements of mismeasurement. If we measure labour input by hours worked, this does not account for the skills of those workers. If the skills of the workforce increase, and we do not measure them, this will appear as an increase in productivity. Research and development, and other investments in innovative activity, create knowledge or intangible capital that can be used to produce output more efficiently. However, because the inputs used to create this knowledge are often indistinguishable from the capital, intermediates and labour inputs directed towards current production, measurement error can lead to both over- and underestimates of actual productivity growth.

Glossary

Term

Definition

Baumol’s cost disease

The inability of some labour-intensive activities to substitute labour with technology (capital) over time causes costs in such activities to rise, relative to other activities. Where low-productivity-growth sectors compete for labour with high-productivity-growth sectors, wages in lower-productivity sectors may grow faster than the measured productivity in that sector.

Capacity utilisation

The level of production capacity that is being used to produce output at any given time. Capacity utilisation indicates the output produced with given resources, compared with the potential output that could be produced if capacity were fully used.

Capital deepening

An increase in capital intensity (as indicated by the capital–labour ratio) by increasing the amount of machinery, equipment, etc, for each worker. Firms or economies that are “capital shallow” have relatively little capital for their labour force to work with.

Capital inputs

The use or consumption of capital in the production of outputs. Capital inputs include, for example, land, buildings, vehicles, and computers. In growth accounting and productivity measurement, “capital” generally refers to traded physical (and some intangible) assets —the equipment and structures used to produce goods and services. These capital inputs are distinct from the capital in Treasury’s Living Standards Framework (The Treasury, 2021), which additionally provides for the following.

•    Natural capital: all “aspects of the natural environment that support life and human activity”.

•    Human capital: the “capabilities and capacities of people to engage in work, study, recreation, and social activities”.

•    Social capital: the “norms, rules and institutions that influence the way in which people live and work together and experience a sense of belonging”.

Capital–labour ratio

The ratio of capital employed to labour employed – a measure of capital intensity.

Capital services

The flow of services from the stock of past investments. For example, the capital services provided by an office building can include protection against rain, comfort, and storage services.

Commodity markets

Markets for buying, selling and trading raw materials or primary products.

Digitalisation

The process of transforming business processes to accommodate digitised information and digital technologies.

Entity

The central unit of analysis, that is, the “thing” for which inputs, outputs – and therefore productivity – are being measured. It can refer to a firm, public sector agency (for example, a school or hospital), region or country.

Frontier firms

Firms at the top of the industry productivity distribution. The 90th percentile (the top 10% of firms) is typically used to define the frontier.

Goods-producing industries

The goods-producing sector includes the following industries: manufacturing; electricity, gas, water, and waste services; and construction.

Gross domestic income (GDI)

Economic activity based on all the income earned while engaged in producing all goods and services output (that is, income paid to generate gross domestic product, or GDP) in a specific time period. These are the returns to labour and capital such as wages, salaries and profits.

Gross domestic product (GDP)

Economic activity based on the market value of all finished goods and services produced within a country's borders in a specific time period. GDP is calculated either:

  • by adding all spending by those who participate in the economy (expenditure approach), estimating the total value of output and deducting the cost of intermediate goods that are consumed in the process (the output, or production approach); or by calculating the income earned by all the factors of production in an economy and subtracting taxes and depreciation (income approach).  

Gross national income (GNI)

Economic activity based on the sum of all income earned by residents of a country, regardless of where the activity occurs.

Growth cycle

A period defined between two peaks in economic growth. Peaks are determined using statistical techniques by Stats NZ and are chosen to represent high points in capacity utilisation of the economy. Productivity is best analysed as averaged over growth cycles, removing the effect of changes to capital asset utilisation, labour utilisation and labour quality, which vary cyclically. For more information, see Stats NZ, 2023.

Integrated Data Infrastructure (IDI)

Research database administered by Stats NZ holding linked administrative microdata about people and households relating to their education, income, migration status, justice interactions and health outcomes.

Industry

Industries are grouped by the Australian and New Zealand Standard Industrial Classification (ANZSIC). Examples of industries include agriculture, forestry, and fishing; construction; manufacturing; and retail trade.

Information and Communications Technology (ICT)

Equipment and systems that provide access to digital information through telecommunications infrastructure and devices, including the internet, wireless networks, smartphones, and communication channels (that is, instant messaging, voice over internet protocols (VoIP), video-conferencing, and social networking).

Inputs

The direct and indirect factors involved in the production of outputs. Inputs can be organised into three broad categories: labour, capital and consumables (also called intermediates).

Intangible assets

Assets that are identifiable but are not physical, such as reputation and brand recognition, skills, market research and patents.

Kaupapa

Connected to Māori philosophy and principles.

Labour force

The total working-age population (resident, non-institutionalised population of Aotearoa New Zealand aged 15 years and over) who are classified as “employed” (working) or “unemployed” (available to work).

Labour income share

The share of national income paid out in wages and salaries.

Labour inputs

The labour utilised in the production of outputs, both directly (for example, teachers, for school outputs) and indirectly (for example, administrative staff, who contribute to the functioning of an entity).

Labour participation

The total labour force expressed as a percentage of the working-age population.

Labour productivity

Average output per unit of labour input. Labour productivity represents the total volume of output (measured in GDP) produced per unit of labour (measured in terms of the number of hours worked, hours paid, or the number of workers), during a given reference period.

Labour utilisation

The sum of those in the labour force that are not unemployed (without a paid job but looking for work) or under-employed (in part-time employment but wanting to work more hours). As with unemployment, under-utilisation is a broad measure of spare capacity in the labour market.

Longitudinal Business Database (LBD)

Research database administered by Stats NZ, holding linked administrative microdata about businesses. Researchers use the LBD to evaluate policies and analyse business performance.

Market-provided services

Services that are provided at economically significant prices, usually to generate a profit.

Mātauranga

Modern term for the combined knowledge of Māori living in Aotearoa

New Zealand, comprising the te ao Māori indigenous worldview of relationships between people and the natural world. Humans are not seen as superior

or external to the natural world but as existing within it. Natural flora and fauna are akin to humankind, and all phenomena dwell in an intricate web of relationships and interconnections, all living within “the woven universe”. The term encompasses language (te reo), education (mātauranga), traditional environmental knowledge (taonga tuku iho, mātauranga o te taiao), traditional knowledge of cultural practice, such as healing and medicines (rongoā), fishing (hī ika) and cultivation (mahinga kai).

Measured sector (MS-16)

The measured sector comprises the 16 industries included in Stats NZ’s standard productivity statistics from 1996 to 2011, covering all predominantly market industries. The measured sector covered 76.7% of Aotearoa New Zealand’s GDP in 2019.

Measurement error

The difference between a measured quantity and its true value. It includes random error (naturally occurring errors expected with any specific measurement) and systematic error (caused by a misspecification that affects all measurements).

Multi-factor productivity (MFP)

The change in output that cannot be attributed to changes in the level of labour or capital input. Measures of MFP capture factors such as advances in knowledge, improvements in management and production techniques, and mismeasurement. MFP is also known as total factor productivity.

MFP is widely interpreted as an indicator of technological change. In the short-to-medium term, MFP estimates are subject to data limitations and assumptions, such as variations in capacity utilisation, economies of scale and scope, reallocation effects of capital and labour, and measurement error.

National accounts

The aggregated indicators of measured economic activity in an economy, guided by the system of national accounts (SNA), which is the international standard for measures of economic activity, enabling consistency and comparisons across countries.

Nominal (GDP, GNI, wages etc)

Measurement that uses current prices and is not adjusted for inflation (compare with “real” GDP, etc).

Non-market provided services

Services that are supplied for free or below economically significant prices, typically by governments or non-profit organisations. The three industries with the highest share of non-market provision in Aotearoa New Zealand are healthcare and social assistance, education and training, and public administration and safety.

Outputs

Goods and services produced by entities in an economy. Technically, volume is a combination of both quantity and quality, meaning that output measurement captures economic value.

Primary industries

Stats NZ defines the primary sector to include the following industries: agriculture; forestry; fishing; and mining. The primary sector does not include further processing of raw materials, such as farm products like raw milk and livestock (classified as food and beverage manufacturing), nor does it include moving goods to market (part of distribution services).

Productivity

Productivity measures illustrate how well an entity uses resources (inputs) to produce goods and services (outputs). It is calculated as the ratio of the quantity of outputs produced to some measure of the quantity of inputs used.

Productivity frontier

The productivity level of an entity (or entities) that has the best possible production practices. The closer to the frontier, the higher an entity’s productivity.

Production possibility frontier (PPF)

A curve that illustrates the maximum possible output combinations of two products or services an economy can achieve if all resources are fully and efficiently utilised. The curve is used to demonstrate where, and in what products, an economy reaches its greatest level of productive efficiency. Other products can be imported for consumption via trade with other nations.

Purchasing power parity (PPP)

A metric used to compare economic productivity and standards of living between countries by using a common "basket of goods”.

Real (GDP, GNI, wages, etc)

In contrast to nominal value, the “real” value is the measure of value expressed in terms of constant dollar purchasing power. A price index, with the level fixed in a specified base year, is applied to adjust nominal values of a quantity (such as wages or total output produced) to obtain real values.

Reallocation

The process of resources (labour and capital) and market share shifting between firms or industries. Shifts from low- to high-productivity firms or industries are considered as “productive”.

Recession

Two consecutive quarters of negative gross domestic product (GDP) growth.

Residual

The quantity remaining after other things have been subtracted or allowed for. Growth accounting and econometric approaches to calculating MFP as a residual that is not explained by measured factors of production.

Services industries

Stats NZ defines the service sector as including the following industries.

  • From 1978: wholesale trade; retail trade; accommodation and food services; transport, postal, and warehousing; information media and telecommunications; and financial and insurance services.
  • From 1996: the industries above, plus rental, hiring and real estate services; professional, scientific, and technical services; administrative and support services; and other services.

Service industries now represent approximately two-thirds (65%) of the economy in 2020, compared with about half in the 1970s.

Terms of trade

The ratio of a country’s export prices and its import prices, indicating how many units of exports are required to purchase a single unit of imports. Measurements are often recorded as an index for economic monitoring.

Total factor productivity

See multi-factor productivity (MFP).

Tradeables/ non-tradeables

Tradeable industries are industries that produce goods and services that can be traded across regions and international borders and are exposed to international competition.

Non-tradeable industries are industries where output faces no international competition.


List of boxes

Box 1

Productivity measures reveal little about the distribution of material living standards

11

Box 2

A brief history of GDP – from war to cooperation

21

Box 3

Measuring labour input

24

Box 4

Innovation, research and development, and intangible capital

29

Box 5

Options for measuring environmental productivity

30

Box 6

What drives improvements in the productivity of nations?

52

Box 7

Research and development, and skills

54

Box 8

Types of Foreign Direct Investment (FDI)

66

Box 9

The Research and Development Tax Incentive

86

Box 10

Options for revising policy settings to better support workers

89


List of figures

Figure 1.1

The Treasury’s Living Standards Framework

7

Figure 1.2

He Ara Waiora

8

Figure 1.3

How productivity relates to current and future wellbeing

9

Figure 2.1

In the last decade and a half, positive terms of trade changes have increased incomes

16

Figure 2.2

Aotearoa New Zealand’s terms of trade

17

Figure 2.3

Some of the income gains have flowed abroad

18

Figure 2.4

A large portion of primary income flows are direct income

19

Figure 2.5

Gross vs Net National Income per capita, 2021

20

Figure 2.6

The drivers of material living standards

22

Figure 2.7

New Zealanders work longer hours and get less output per hour than most OECD countries

25

Figure 2.8

Intangible capital: Broad categories and types of investment

29

Figure 3.1

Aotearoa New Zealand’s productivity has lagged behind other developed countries

33

Figure 3.2

Productivity growth globally has slowed since the 1970s

34

Figure 3.3

Aotearoa New Zealand’s relative decline began in the mid-20th century

35

Figure 3.4

Aotearoa New Zealand’s growth has come from working more hours, rather than increased productivity


36

Figure 3.5

New Zealanders continue to work long hours

37

Figure 3.6

Aotearoa New Zealand’s employment rate has recovered strongly since the 1990s

37

Figure 3.7

Aotearoa New Zealand has long been a low-capital economy

38

Figure 3.8

Sources of growth have varied across economic cycles

39

Figure 3.9

Cyclical contributions to output growth

40

Figure 3.10

Most GDP growth since the 1980s has occurred in the services sector

41

Figure 3.11

Services industries present a mixed productivity picture

42

Figure 3.12

Labour productivity (annualised average growth), 2008–2022

43

Figure 3.13

Productivity in the public sector

44

Figure 3.14

Labour productivity (GDP per capita and GDP per hour worked), 2010–2021

46

Figure 3.15 Quarterly hours worked and employment (seasonally adjusted) 47
Figure 3.16 Output and labour input growth, 2008–2022 48
Figure 3.17 Labour productivity, 2008–2022 48
Figure 3.18 Labour productivity and hours worked during the COVID-19 pandemic 49
Figure 4.1

Aotearoa New Zealand has low investment in R&D

54
Figure 4.2

Aotearoa New Zealand’s innovation performance varies by industry

55
Figure 4.3

GFCF as a percentage of GDP

56
Figure 4.4

Employees in Aotearoa New Zealand work with less machinery and equipment

57
Figure 4.5

Aotearoa New Zealand has an underdeveloped equity market

58
Figure 4.6

Venture capital is low

59
Figure 4.7

Short-term interest rates

60
Figure 4.8

Disinvestment in environmental capital

61
Figure 4.9

Export intensity and population

63
Figure 4.10

The NZ dollar experiences wide swings relative to trading partners

64
Figure 4.11

Merchandise exports in Aotearoa New Zealand are heavily concentrated in food & beverages

65
Figure 4.12

Inward FDI has been falling, outward FDI is among the lowest in the OECD

66
Figure 4.13

Management capability has been low, especially people management capability

67
Figure 4.14

Tertiary qualifications levels are about average in the working-age population

68
Figure 4.15

Our emigrants are more likely to be highly educated

69
Figure 4.16

The quality of maths, science and reading literacy have been declining for some time

70
Figure 4.17

There are substantial inequalities in educational achievement across the curriculum

71
Figure 4.18

Aotearoa New Zealand has invested a similar share of GDP into infrastructure as other high-income countries, with a heavy weighting on telecommunications

72
Figure 4.19

Aotearoa New Zealand and Australia’s construction input costs relative to ten other high-income countries

73
Figure 4.20

Institutional quality

74
Figure 4.21

Trust in government

75
Figure 4.22

Product market regulation is generally good

76
Figure 4.23

Aotearoa New Zealand has a business-friendly environment

76
Figure 4.24

Aotearoa New Zealand has a high rate of firm birth and death

78
Figure 5.1

Six recommendations for implementing focused innovation policy

88


List of tables

Table 4.1

Firm dynamics

77

Table 5.1

Published Productivity Commission inquiries

81