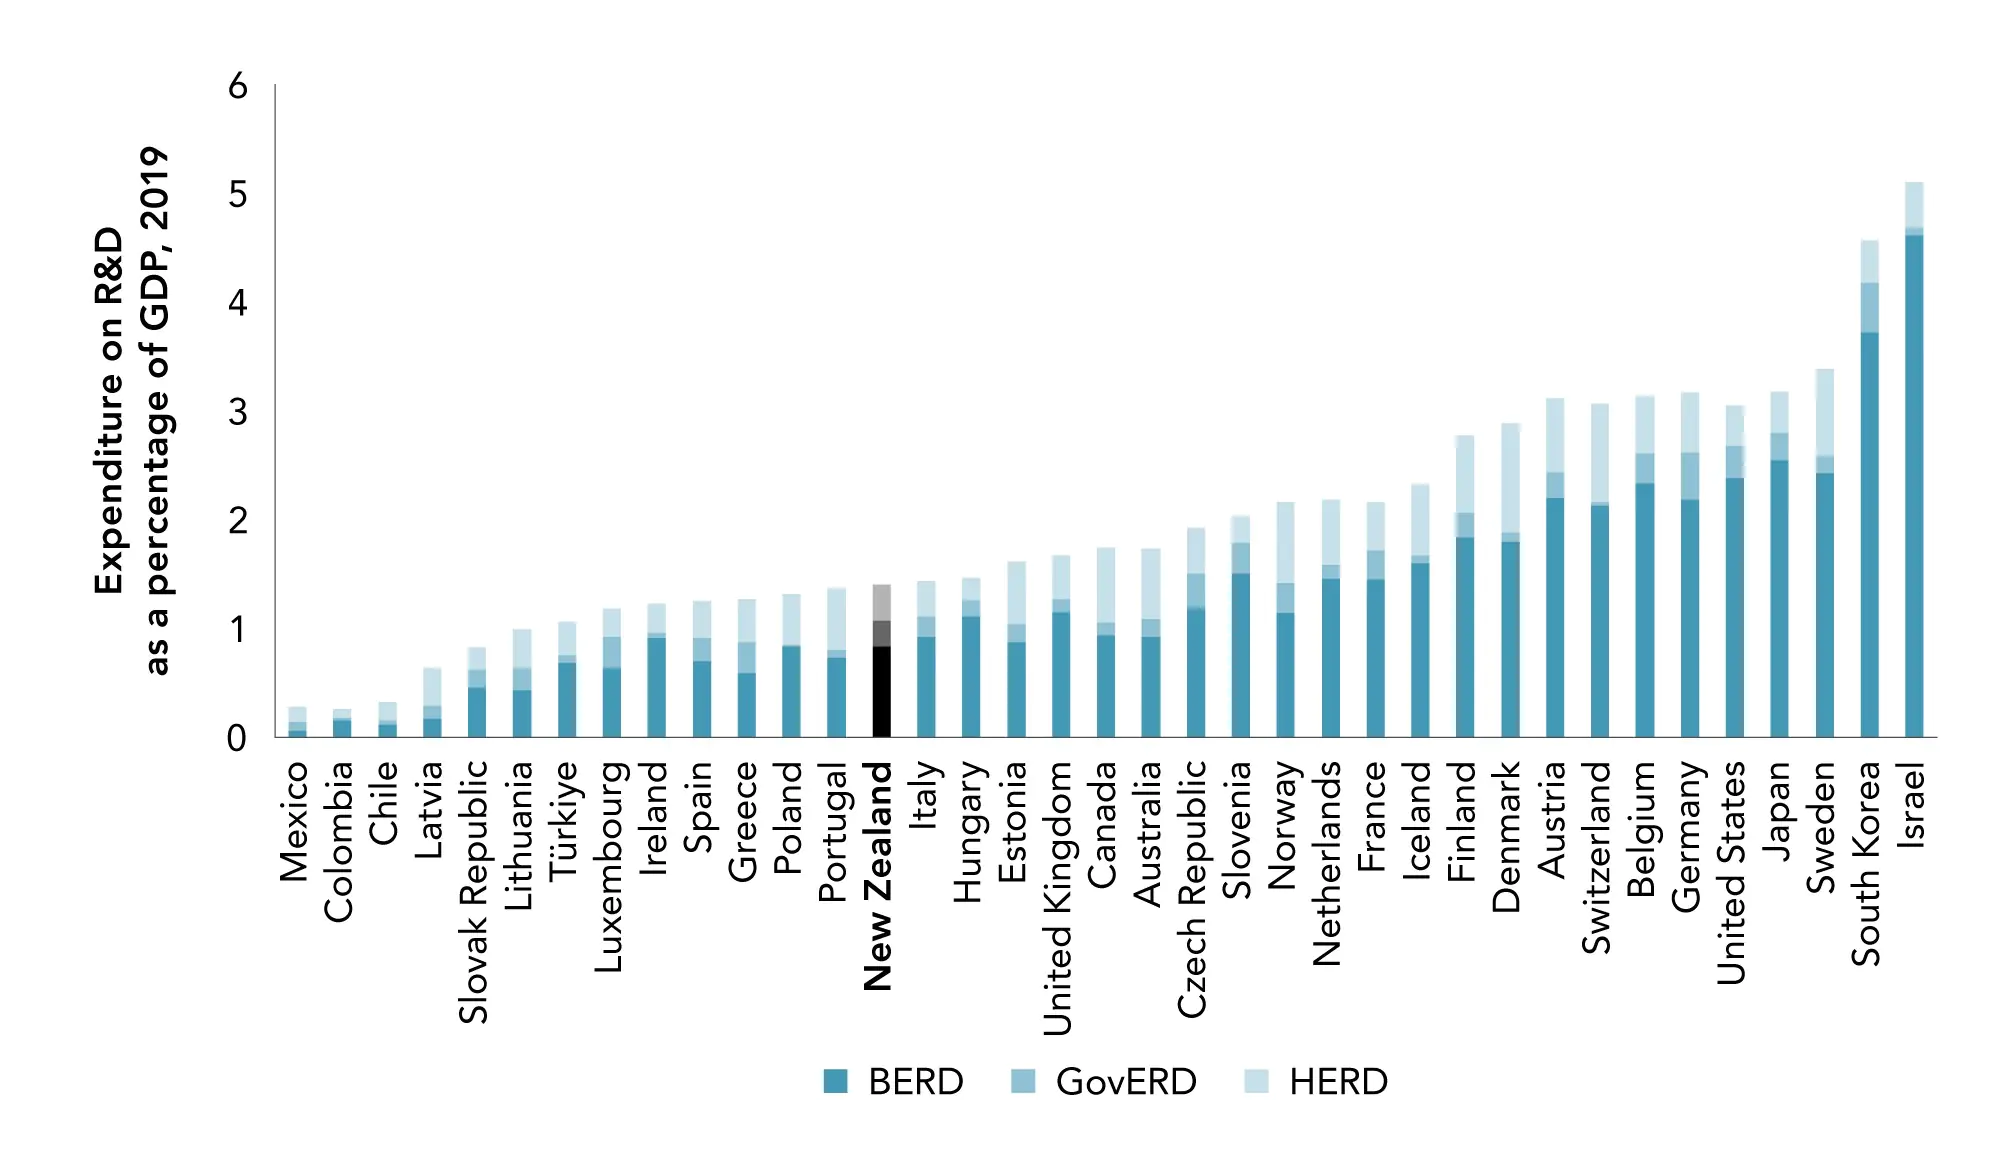
Innovation through research and development helps boost productivity, and as a country we still under-invest in R&D, both at a business and a government level, compared to other countries.
Catherine Beard | BusinessNZ
Part 3 of this report examined several aspects of Aotearoa New Zealand’s recent and long-term productivity performance. In Part 1 and Part 2, we noted that this productivity performance is not simply ordained by a higher power; rather, it depends crucially on investments we have made maintaining, improving, and adding to our productive capacity. To understand how we might improve New Zealand’s productivity and wellbeing, we need to understand more about the factors that underpin it. These are areas where government can help – or harm – the economy.
We will now look at some of the underlying determinants of productivity (see Figure 2.6), to shed some light on the elements that are not explicitly measured or do not appear as components in the national accounts.
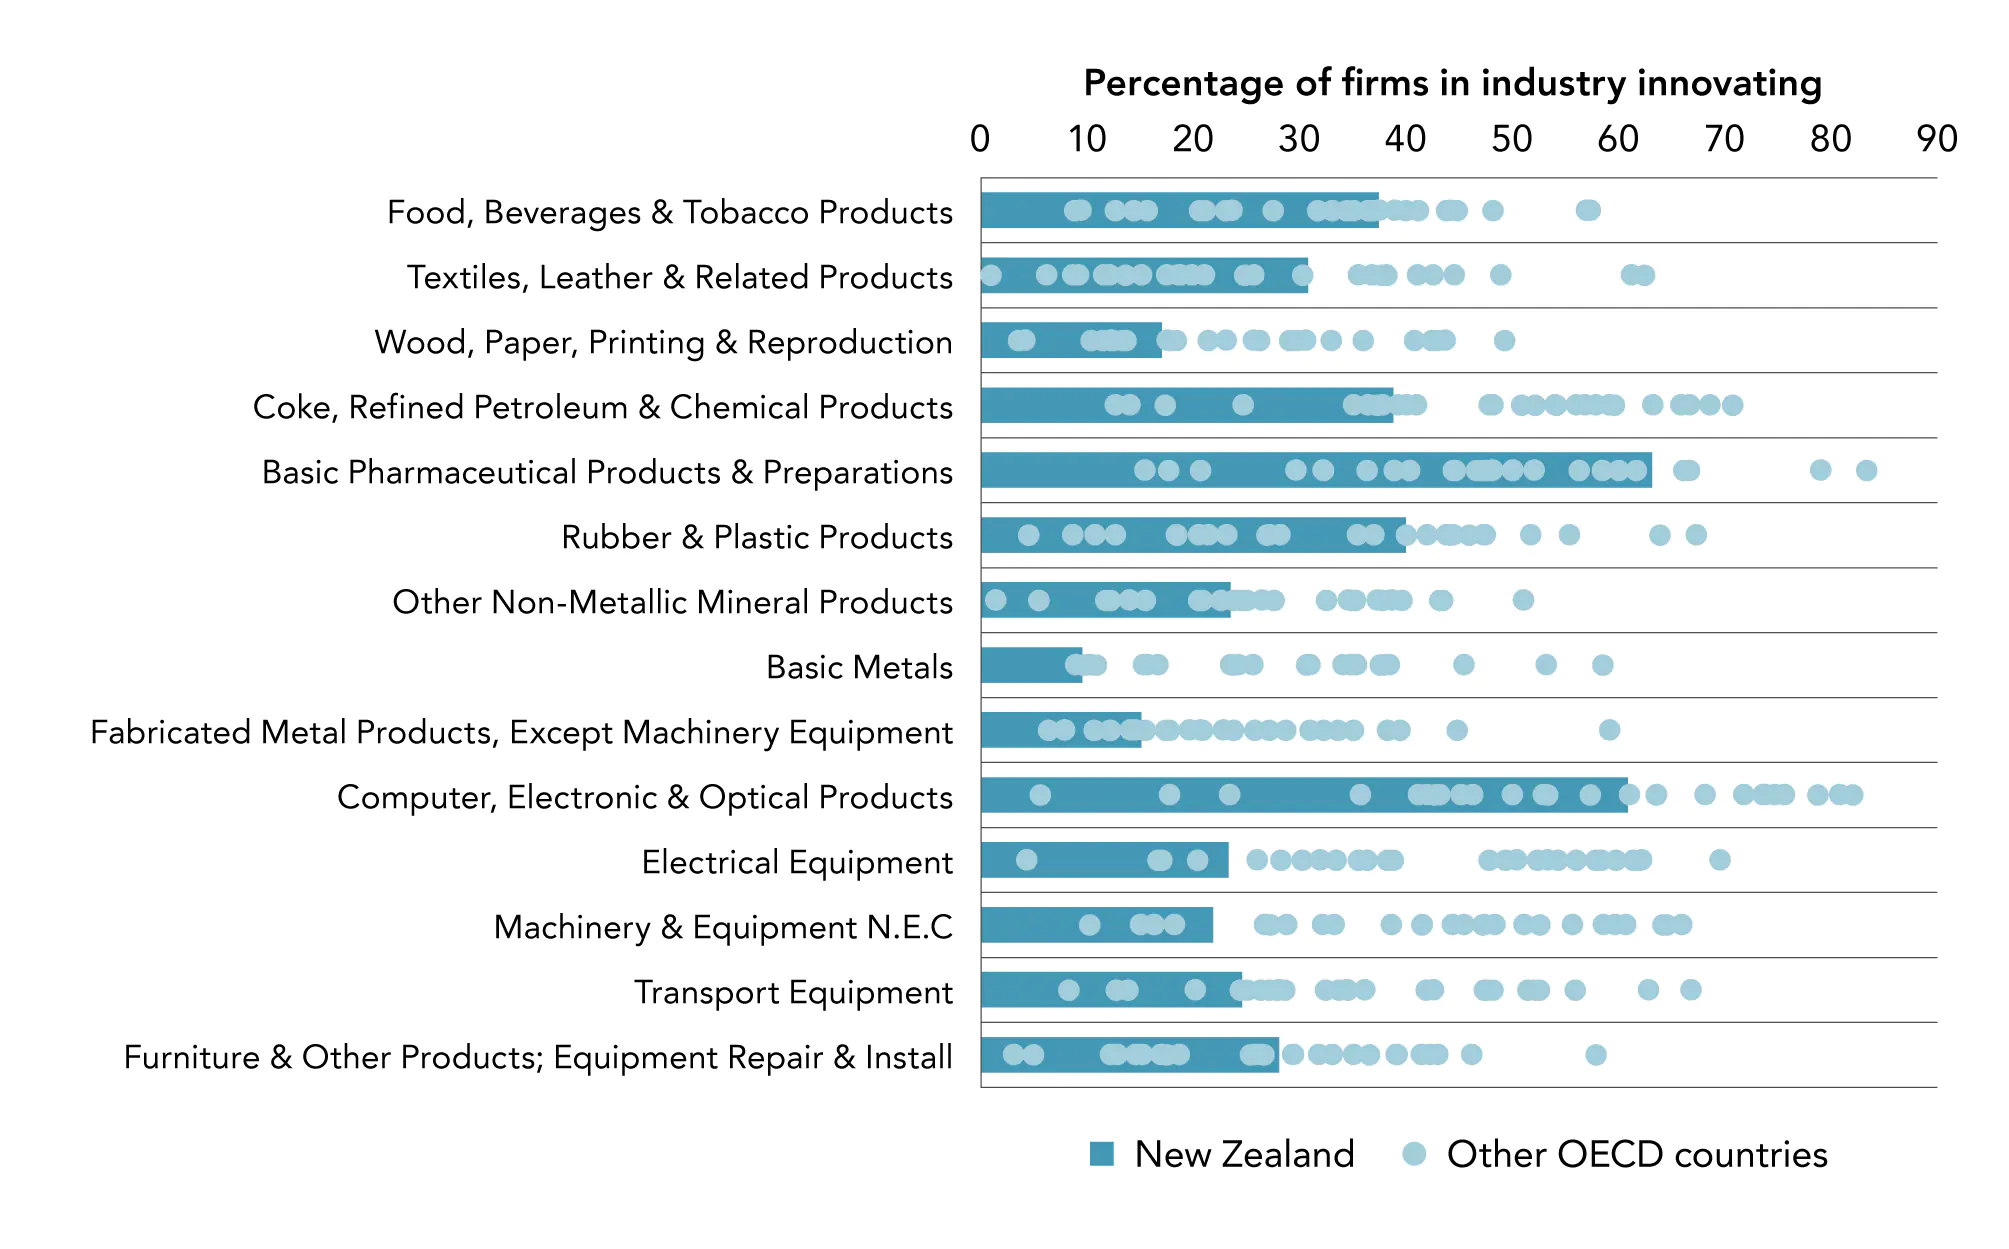
- Innovation
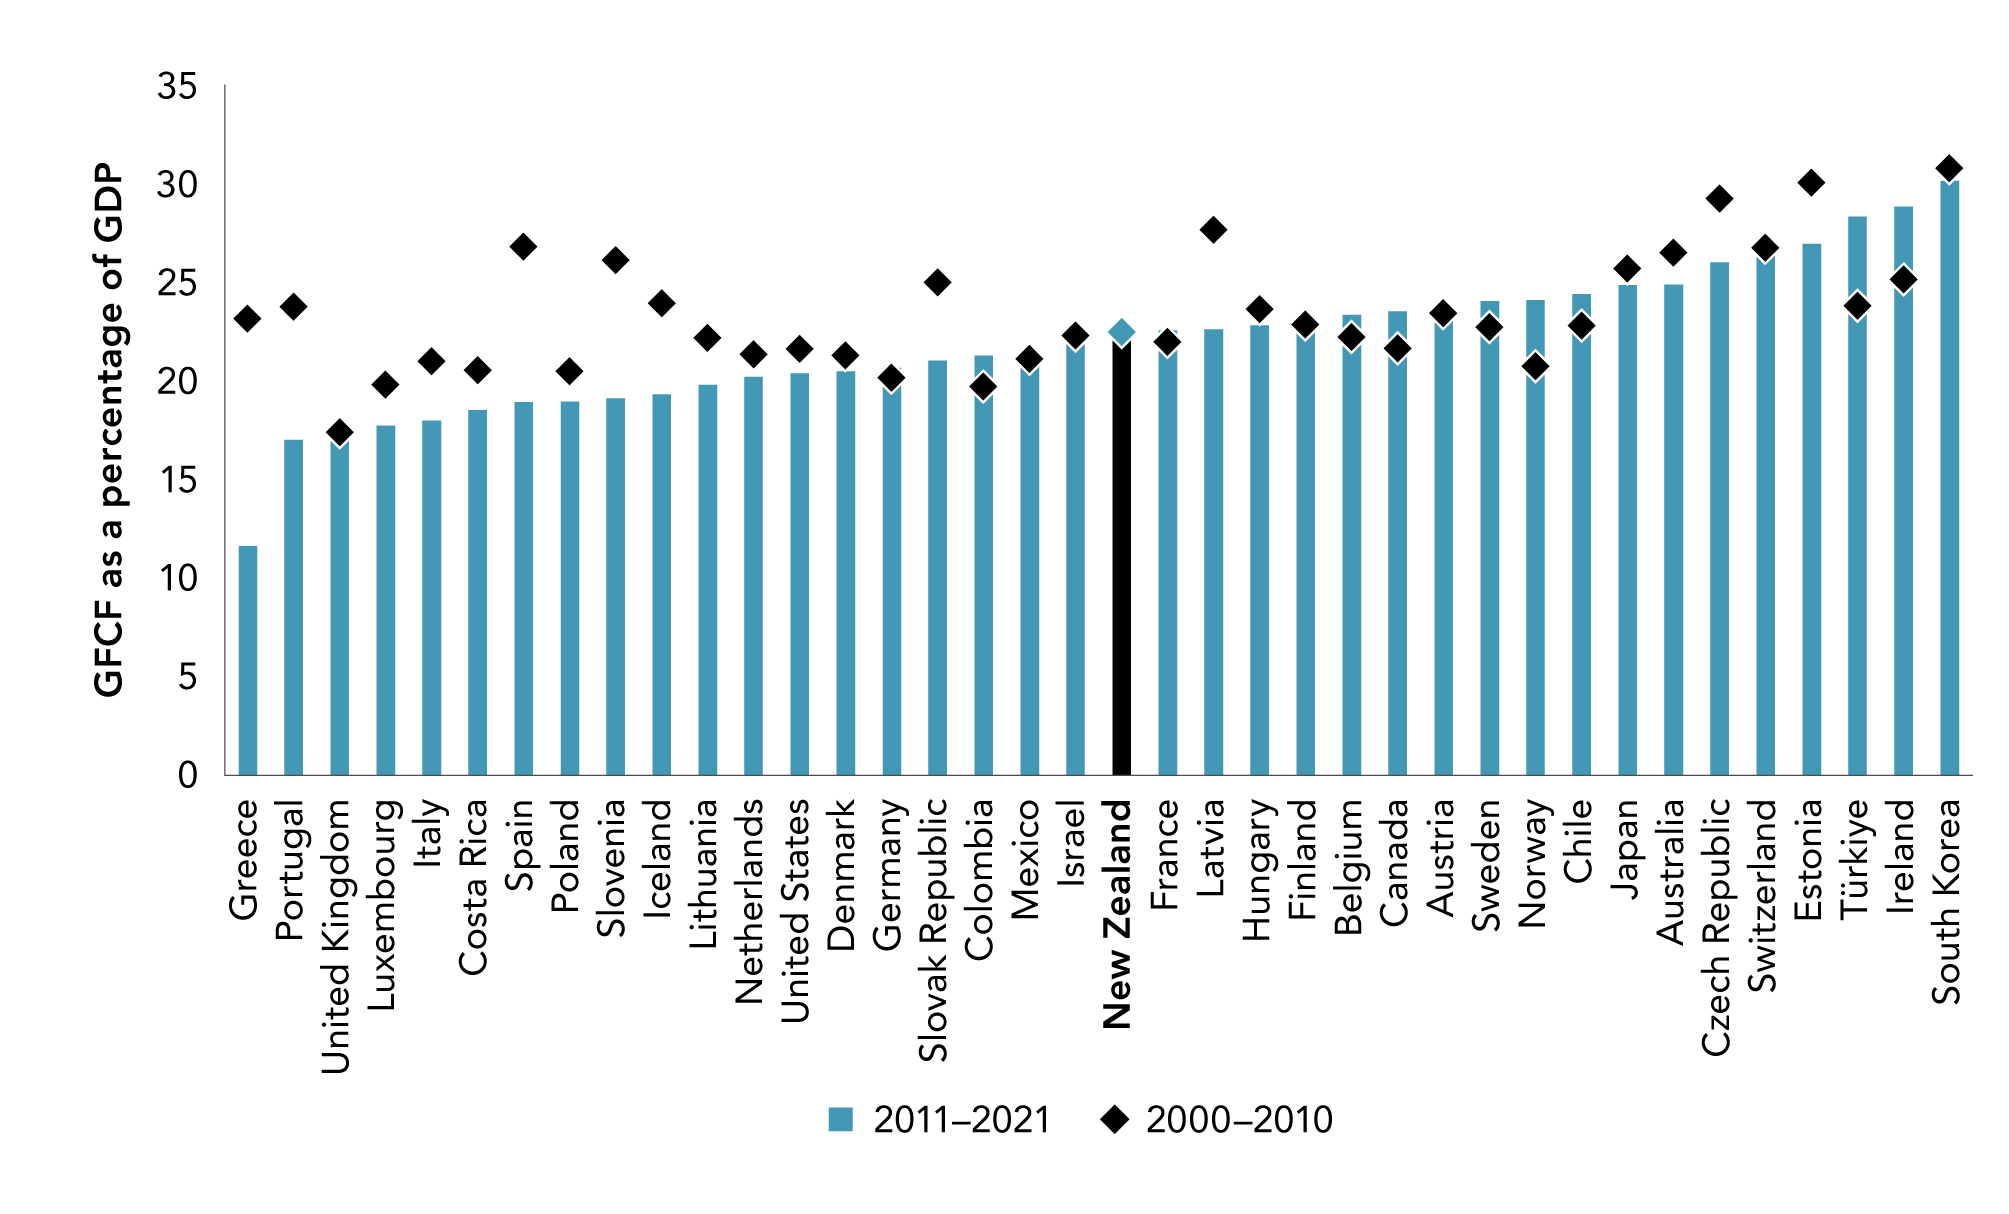
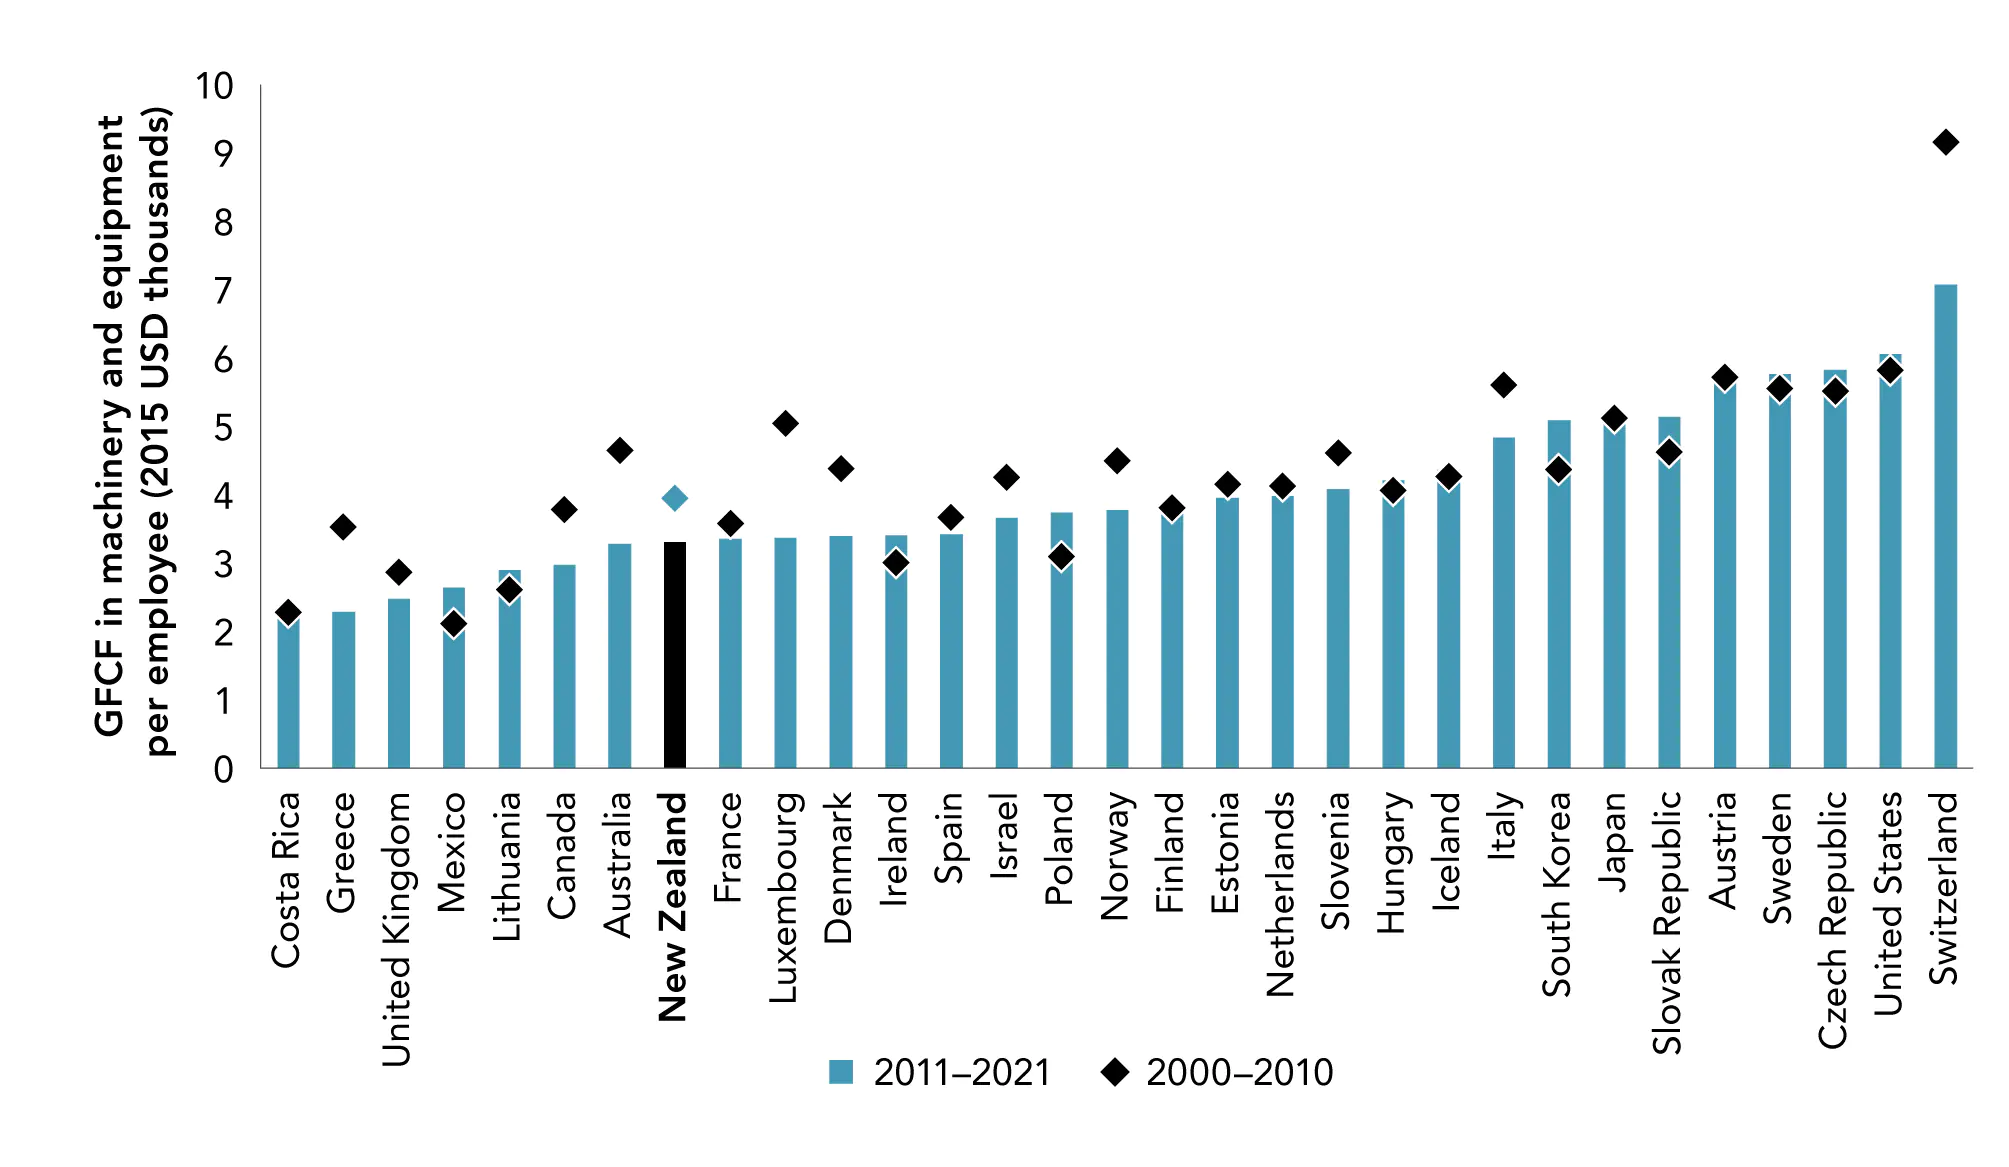
- Investment, capital and financial markets
- International linkages
- Business dynamics and capability
- Skills and education
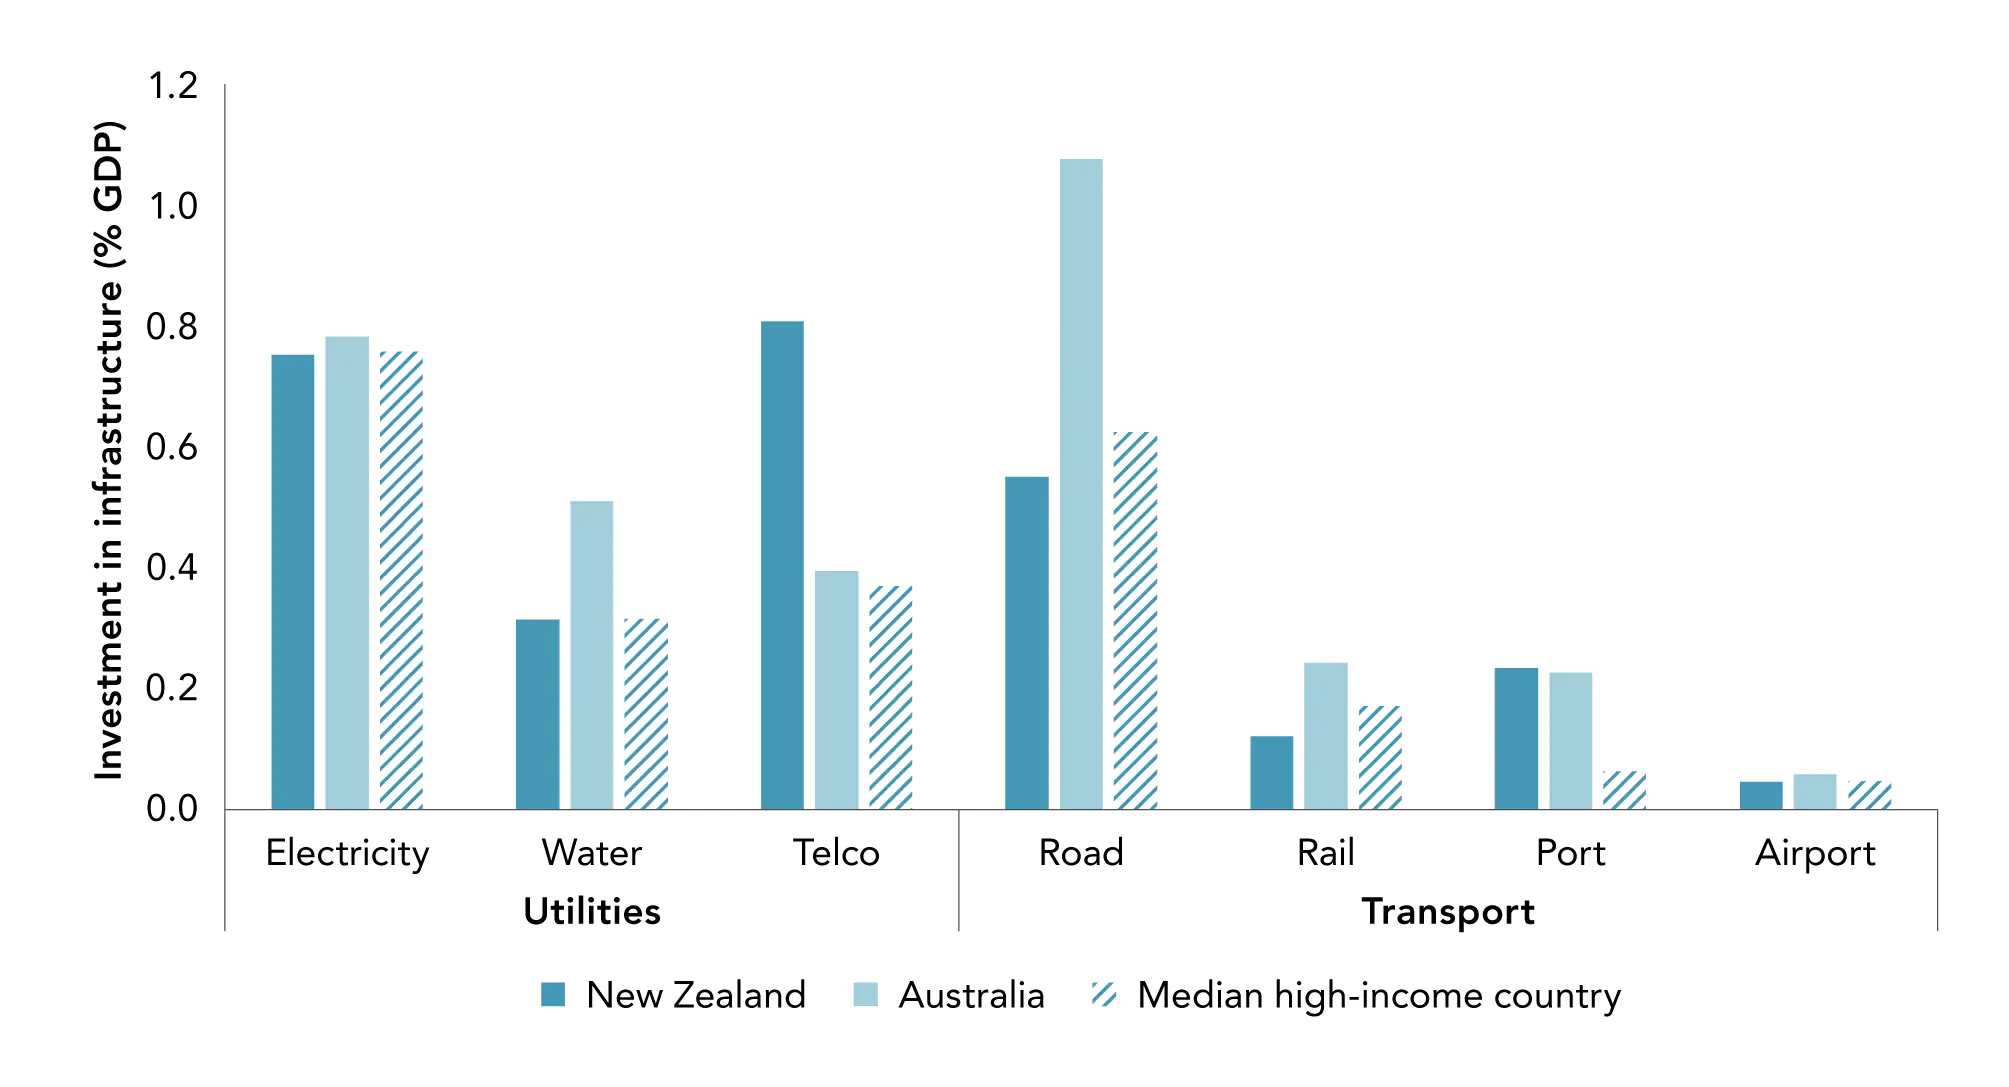
- Infrastructure
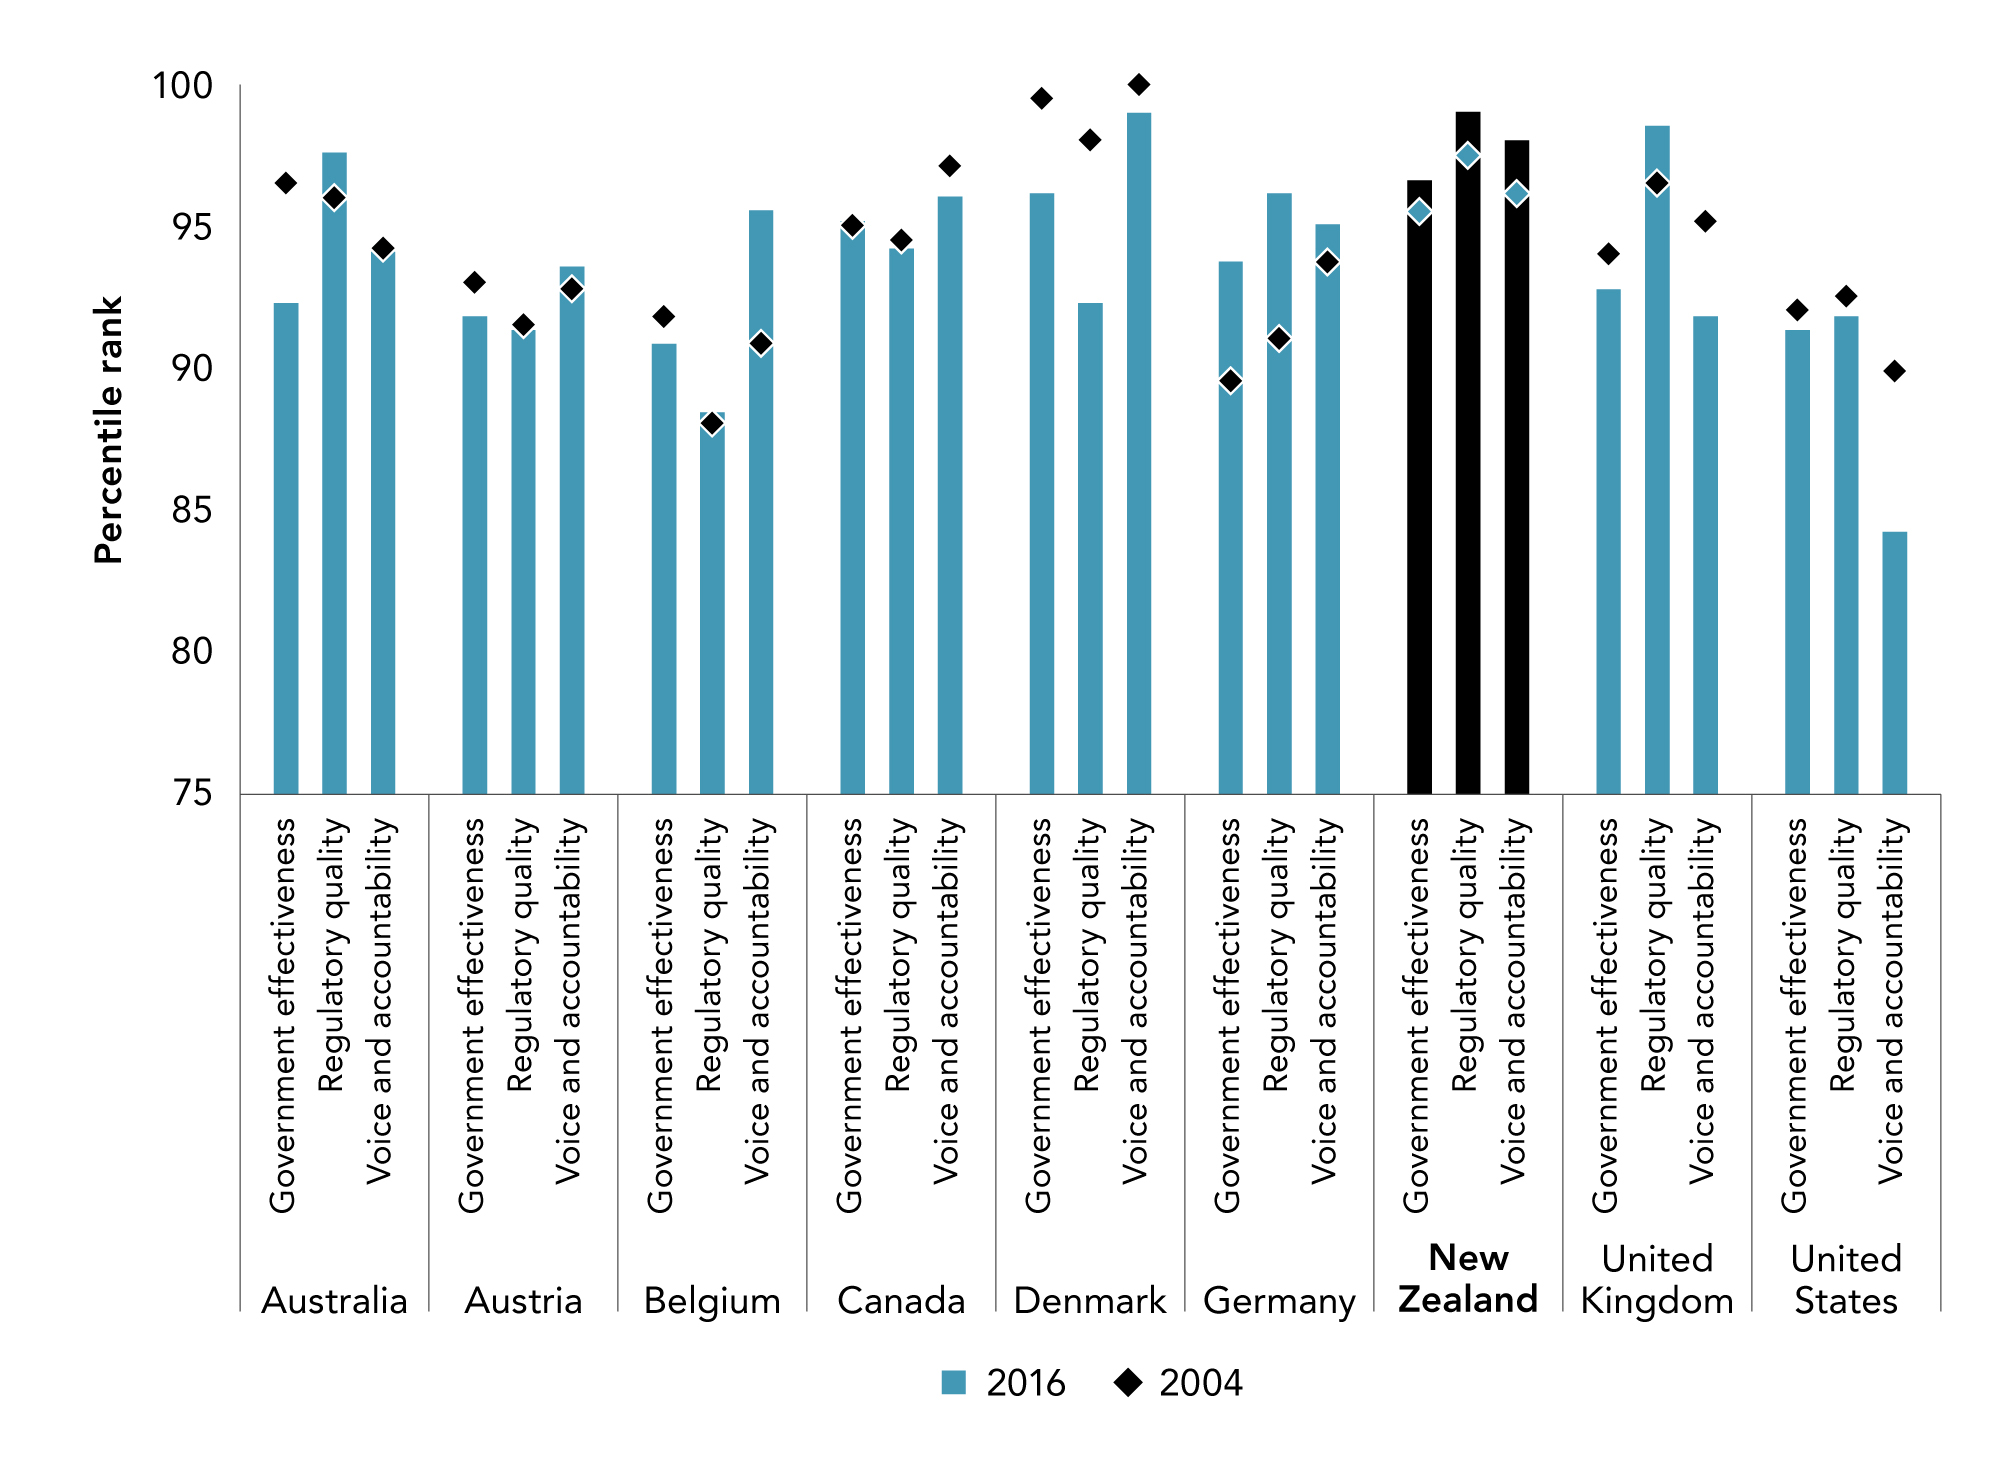
- Institutions
These underlying determinants broadly align with what The Treasury’s (2021) LSF29 refers to as “The Wealth of Aotearoa New Zealand” and “Our Institutions and Governance” (p. 3). In this publication, we focus in more detail on the aspects that most impact wellbeing through their relationship with productivity.
This examination will not be exhaustive, but it gives an indication of things that matter and areas where we might improve.
| Box 6 What drives improvements in the productivity of nations? |
|---|
|
Towards the end of the 20th century, economists began to look beyond simple explanations of why some nations were more prosperous than others, based on raw labour, capital, and an unexplained residual. Models and evidence developed elsewhere were brought into macroeconomic models. These included the role and importance of:
However, underlying them all is the creation and adoption of new technology (Grossman & Helpman, 1991; Romer, 1990). Technological progress occurs when new goods and services, production, and organisational methods are devised, or when existing ones are improved upon – in short, when there is innovation. Innovation is not an end in itself; it is merely the first stage in a broader process where knowledge becomes economically useful. |