Part 2 | Accounting for productivity
Table of contents
Productivity is all about the ‘why’, ‘what’ and ‘how’ we utilise and combine people and resources to leave a better world for future generations, being in service of human dignity and upholding the mana of te taiao.
Tania Pouwhare (Ngāi Tūhoe) and Chrissie Hape | Chairs, Māori Economic Development and Advisory Board (MEDAB)
In Part 1, we introduced productivity as a concept, and related it to income, investment, and wellbeing. This publication is about the numbers, so to move from theory to evidence, there are several important things to consider when we seek to measure productivity and understand what we find.
“Productivity” measures how well an organisation, industry, or country is using the resources available to it. It is calculated as the ratio of the volume of output produced, relative to the volume of inputs (such as labour and capital) used (Hulten, 2007; Schreyer & Pilat, 2001). Measures of volume are a combination of both quantity and quality, meaning that output measurement captures economic value. For example, productivity can increase if the number of apples produced go up. But productivity can also increase if the apples get tastier and people are willing to pay more if a new type of apple is produced, or if a more efficient method of harvesting is developed.
Innovation lies at the heart of productivity growth.
Most of the growth in productivity and material living standards over the centuries has come from combining inputs into new products and services – such as antibiotics and anti-slip mats – rather than from improving processes to be more efficient hunters or gatherers (Stevens, 2011). Some of these advances have been marginal and others pervasive. General purpose technologies (such as steam power, electricity and computing) are technologies that are widespread, improve over time and can set in motion complementary innovation to support and build off them (Bresnahan & Trajtenberg, 1995). These complementary investments lead to impacts and assets that are hard to measure, so it takes time to understand their impact (Brynjolfsson et al., 2021). This can lead to an ongoing race between technology and measurement, as people find new things to do and ways to do them that were not envisaged a generation ago, and statistical agencies update their methods as existing measures cover less of the economy.
2.1 Production, income, and consumption
The national accounts of a nation paint a picture of the production that occurs, the income earned, and the expenditure on goods and services. The most common measure of what Aotearoa New Zealand produces is Gross Domestic Product (GDP). This measures the amount of goods and services produced in New Zealand, including goods produced for export. Imports are not included, because they are produced abroad.
The economy is a complex system of production and exchange. One firm’s outputs are another firm’s raw materials. To prevent double-counting, national accounts measure the value added by each firm, over and above the inputs they use. Economists and national accountants describe the inputs as “intermediate consumption” because they are “consumed” by the process of production. For example, in a bakery, the ingredients used are considered as intermediate consumption, while the value of the bread is called “gross output” – it is the total value of the output. “Value added” is gross output less intermediate consumption, and GDP is the total of the value added of all market production taking place in Aotearoa New Zealand.
Of course, not all the flour and yeast produced in Aotearoa New Zealand is used by bakeries. Flour sold to make cheese scones in household kitchens is itself considered a final output, so its contribution to the nation’s production is the value added to the flour over the grain that entered the mill.
This highlights an issue with national accounting: the production taking place within households or in other community places is difficult to measure and is, therefore, excluded from the national accounts. Accordingly, homemade cheese scones, along with home childcare and DIY, do not appear in the official national accounts. This exclusion in most measures of GDP introduces a gender bias to GDP in societies where roles such as unpaid care work and housework tend to be gendered (Studenski, 1958; Waring, 2018; Waring & Steinem, 1988). Alternative measures, including “non-market production” (such as that in households), have been produced since the 1970s (for example, Ahmad & Koh, 20 1; Chadeau, 1992; Nordhaus & Tobin, 1973). Other examples include whānau and hapū members maintaining whare, marae grounds, and urupā. Similarly, the efforts of volunteers preparing food in wharekai, or kaiako helping with kapa haka training, are also excluded from the national accounts.
Production, prices, and income
Prices complicate matters. The prices of goods and services tend to rise, and national accounting generally must start from nominal values, in part because it is far too complex to count every good produced or service provided and then aggregate them. For example, it is simple to add up the numbers of loaves of bread and – no matter what the price of the bread – we can work out whether we are producing more or less. However, what about wholemeal vs white bread? Bread vs butter? Bread and butter vs wine and cheese? Food vs fence posts and accounting software? Because most goods and services – and the capital and labour used to produce them – are exchanged in markets, these inputs and outputs can be valued at the prices paid for them. At any given time, we can use relative prices to add things up, but prices evolve differently over time. Because of this, real GDP deflates nominal GDP with a price index calculated by looking at how the prices of products and services change.5
What if the price of Aotearoa New Zealand exported goods change relative to imports? If no activity within the country raises its productivity, yet prices of our exports go up, or the prices of our imports go down, New Zealanders can purchase more goods and services. Such changes are favourable shifts in the country’s “terms of trade”.
Similarly, if Aotearoa New Zealand producers shift to products that earn more abroad, and we import goods that cost less, we will gain in terms of the income we earn and the consumption we can afford, despite being no more productive in terms of GDP. These types of changes show the importance of relative prices for understanding how production translates to income and purchasing power, and therefore how it affects material wellbeing.
The impact of the terms of trade for Aotearoa New Zealand is shown in Figure 2.1. The light blue area shows New Zealand’s GDP since 1988, while the dark blue shows the effect of changes in the relative prices of exports and imports. In national accounting terms, this relative price is called the terms of trade, and it creates a gap between growth in real incomes (or Gross Domestic Income (GDI)) and growth in production (or GDP). This gap is called trading gains (or losses). Prior to 2010, GDI growth in New Zealand closely mirrored GDP growth. Since then, relative price changes have led to a growing divergence between the two – an increase in trading gains – with real income increasing more strongly than it would have been if based on output growth alone.
Figure 2.1 In the last decade and a half, positive terms of trade changes have increased incomes
Gross Domestic Product, Gross Domestic Income and the Balance of Trade
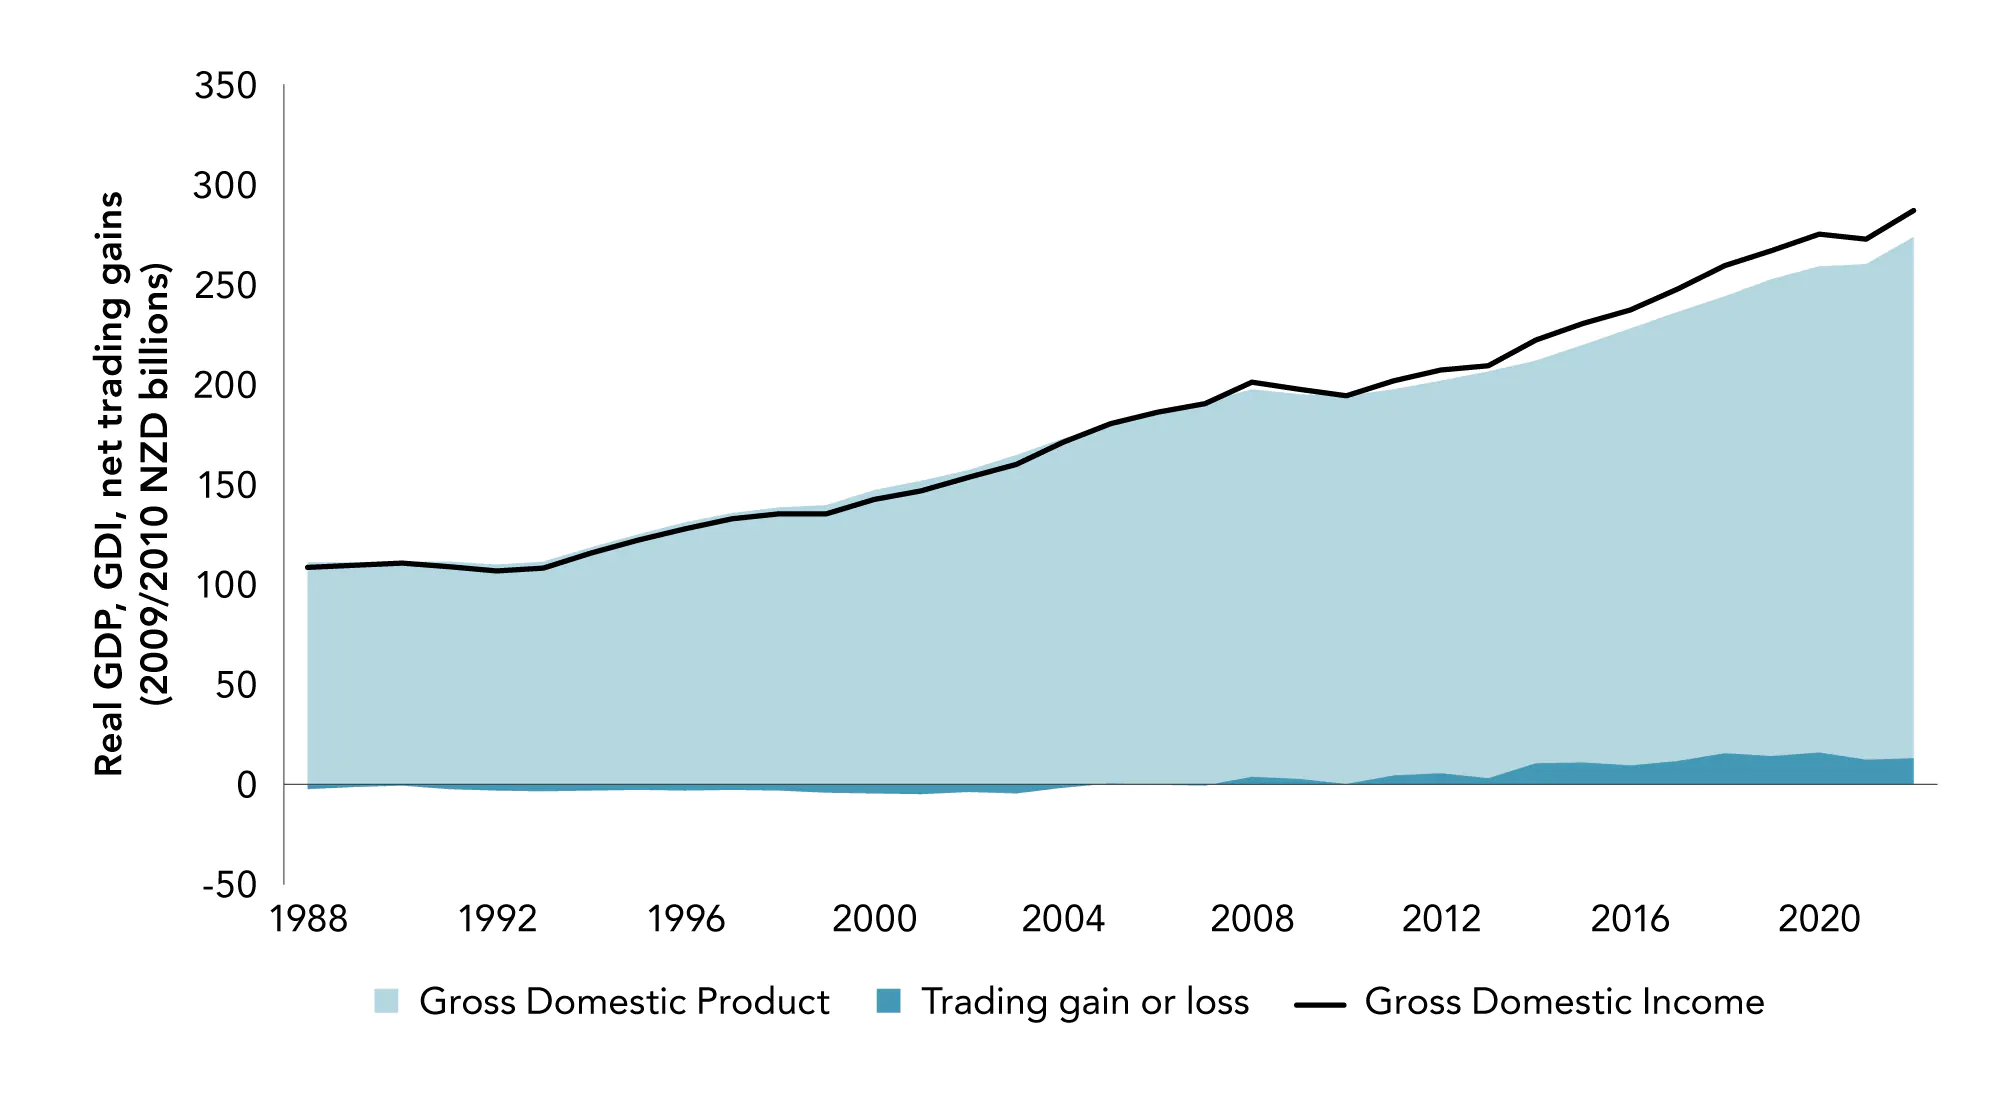
Source: New Zealand Productivity Commission calculations, based on Stats NZ National Disposable Income Account. Notes: Chain-volume series expressed in March year 2009/2010 prices (NZD billions).
GDP = Gross Domestic Product.
GDI = Gross Domestic Income = GDP + trading gain or loss.
Trading gain or loss = the divergence between growth in production and income due to changes in the terms of trade (the relative prices of imports and exports).
Welcome as such changes are, they are often outside a country’s control – particularly for a small country, like Aotearoa New Zealand, with large exposure to commodity markets. Their impact may just be blind luck, or it may be the result of reallocation of economic activity to areas where returns are higher, as can be seen in the shifts in land use from sheep and beef to dairy farming (Grimes & Wu, 2022). However, higher export prices might also be possible through sales teams accessing markets where consumers are willing to pay more. Lower prices might result from a cheaper source of imported intermediate inputs being discovered. A consideration of the history of New Zealand’s terms of trade (Figure 2.2) shows that the experience of the last decade is unprecedented. For most of the last century, New Zealand’s terms of trade have shown little or no trend, often returning to balance and even turning negative on occasion. Rather, they were marked by high volatility, which has driven some major structural changes in the economy and society. Since the turn of the century, the terms of trade have continued on a steady upward trend to levels not seen before.
Aotearoa New Zealand’s small size and exposure to competitive international markets makes its citizens vulnerable to changes in international prices. Positive terms of trade can increase the income of exporters and reduce costs for importers and consumers. However, such improvements may not be good for everyone. Although consumers benefit from lower import prices, some domestic workers may be worse off if the increased foreign competition causes them to lose their jobs and they are unable to find new jobs of a similar quality. Such changes are a risk faced by small trading nations. These shifts can be mitigated, or even turned into new opportunities, if entrepreneurs and firms can respond effectively to them.
Figure 2.2 Aotearoa's terms of trade
Terms of trade (all countries), merchandise imports and exports (June 2002 = 1000)
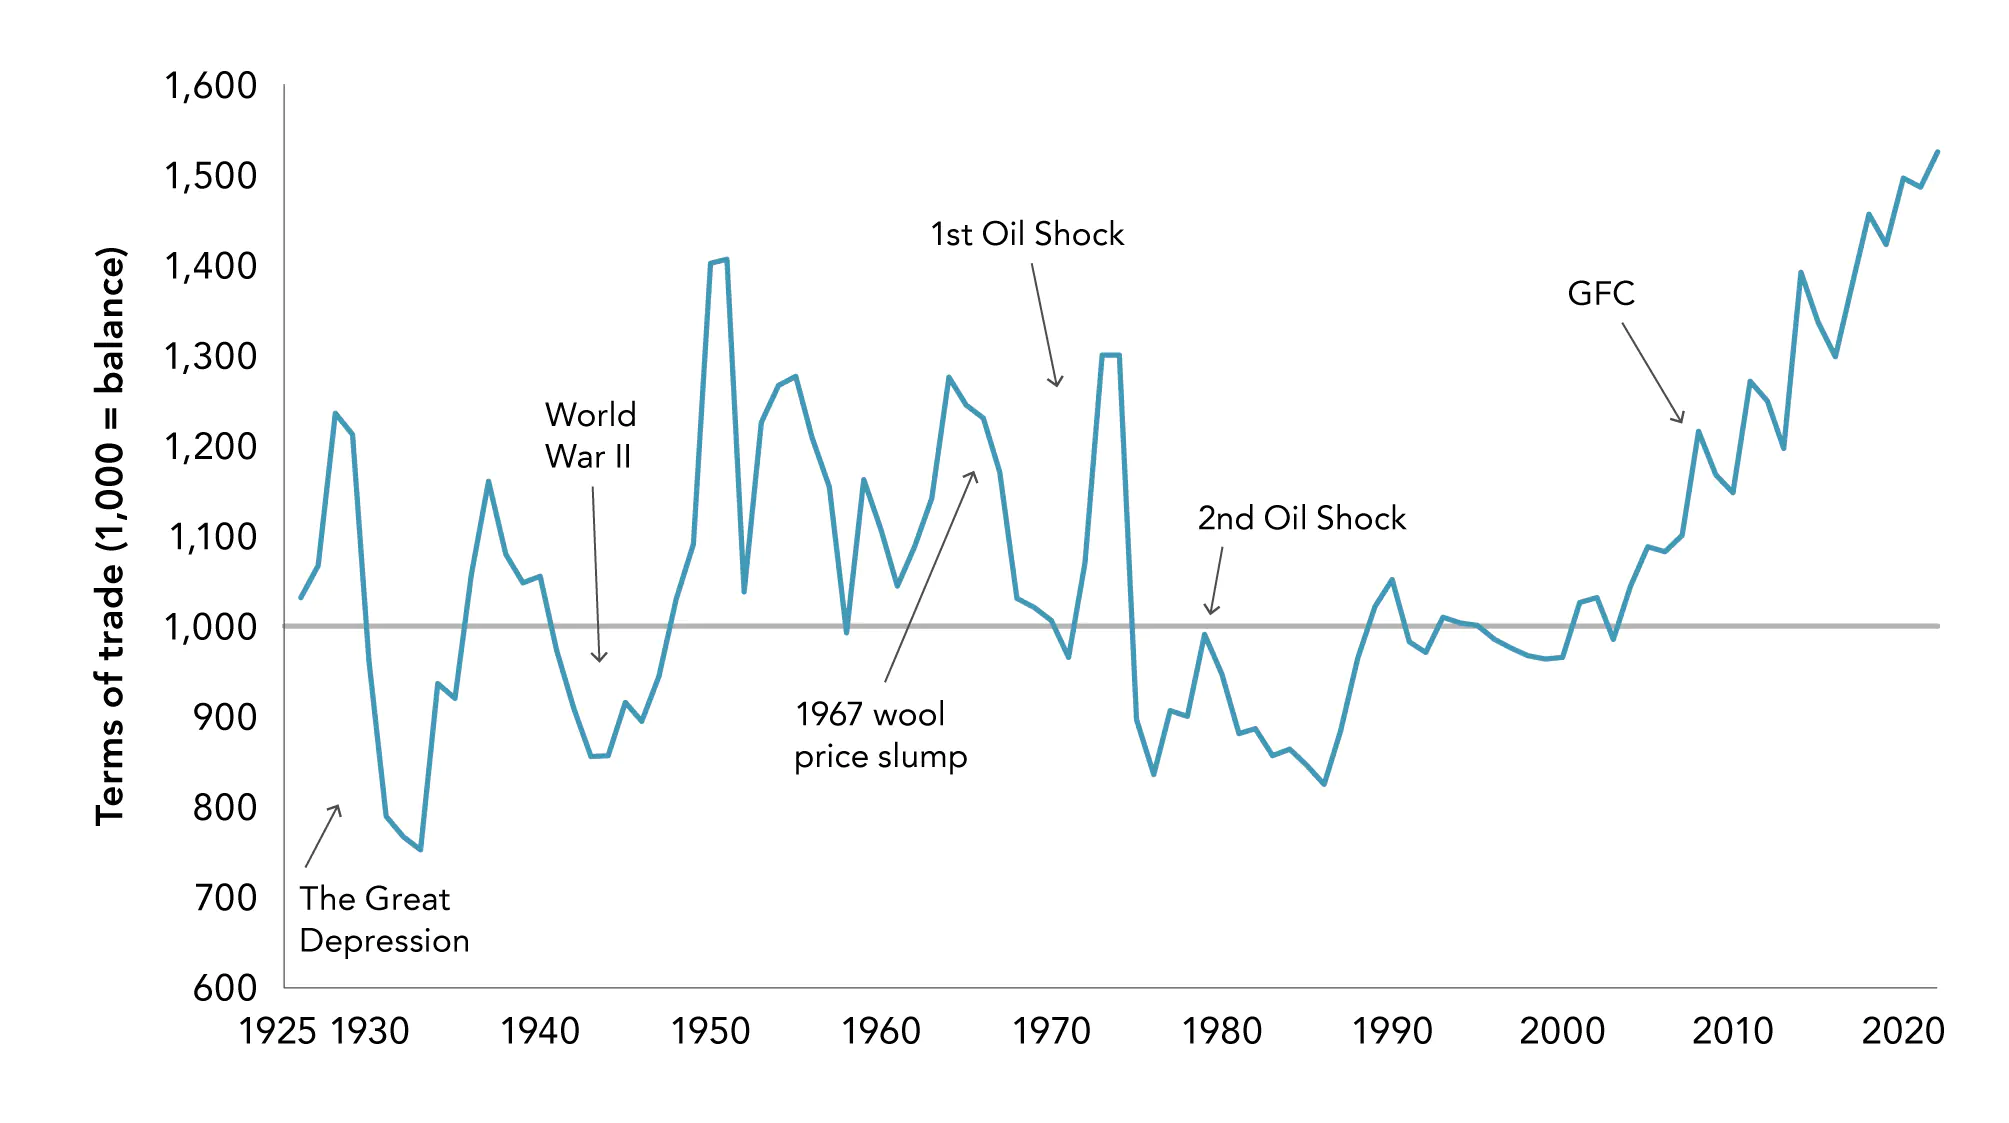
Source: New Zealand Productivity Commission calculations, based on Stats NZ International Trade Statistics.
A related question is who receives the incomes generated from production. Some of the income generated by Aotearoa New Zealand production flows out to foreign investors. Likewise, New Zealand investors also receive income from abroad. “Net incomes from abroad” refers to the recorded difference between income flows to domestic residents from production that occurs abroad and outflows of income from domestic production to non-residents. It includes distributed income from corporations, as well as dividends. If we add this to gross domestic income, we obtain the total income flowing to New Zealand residents (or Gross National Income (GNI)). When we compare GNI to GDI, we see that there has been a net outflow of income from New Zealand for the past 30 years (Figure 2.3). While the terms of trade have improved the income available for consumption (that is, material wellbeing) in recent years, this has been cancelled out by the increase in income going overseas.
Figure 2.3 Some of the income gains have flowed abroad
GDP, GDI, GNI and the flow of incomes, 1988–2022
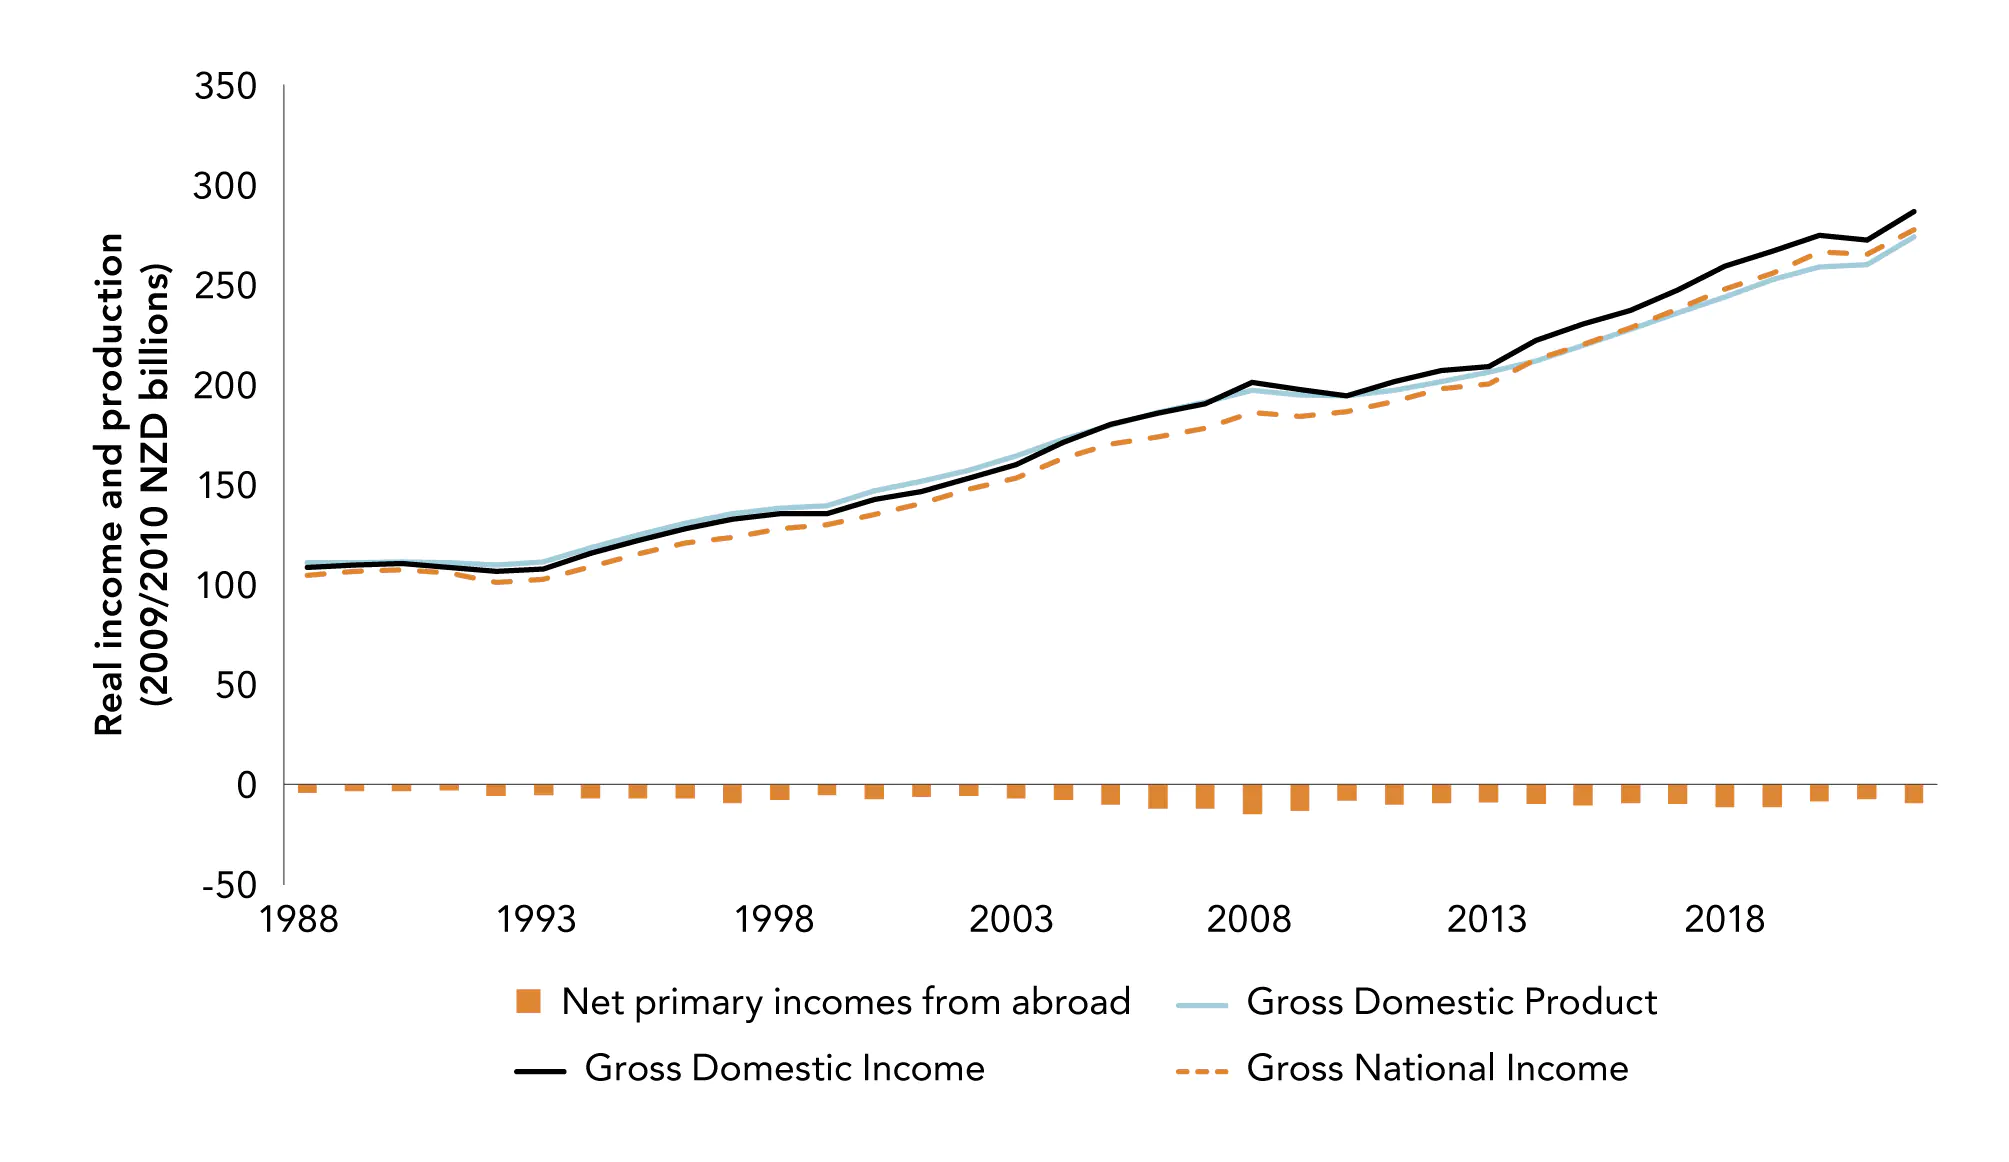
Source: New Zealand Productivity Commission calculations, based on Stats NZ National Accounts. Notes: Chain-volume series expressed in 2009/2010 prices (NZD billions).
GDP = Gross Domestic Product.
GDI = Gross Domestic Income = GDP + trading gain or loss.
GNI = Gross National Income = GDI + net primary incomes from abroad.
Net primary incomes from abroad = inflows of income attributable to overseas production which accrues to Aotearoa New Zealand residents – outflow of income attributable to production occurring domestically accruing to non-residents.
The big difference between the income flowing into Aotearoa New Zealand and the income flowing out is due to income flows from direct investment (Figure 2.4). Direct investment is where a single investor owns 10% or more of voting shares in a company. Portfolio investment is when an investor owns less than 10% of the voting shares of a company, or when an investor holds debt securities issued by a company in which the investor’s ownership interest is less than 10%. Borrowing and lending in the form of debt securities between related depository corporations are also included under portfolio investment. The largest growth in international income for New Zealand over the past 20 years has come from portfolio investment.
Where the other components of net primary income inflows and outflows are more similar, there is a much larger amount of direct investment income flowing out of the country. A major part of these outflows are returns on equity (dividends and distributed branch profits, and return on reinvested earnings), rather than interest payments. This imbalance reflects the lower stock of outward foreign direct investment (FDI) by Aotearoa New Zealand firms (see section 4.3 below), as well as lower returns to our outward investment compared to foreign investment into the country (OECD, 2017a).
Figure 2.4 A large portion of primary income flows are direct income
The composition of flows of primary income
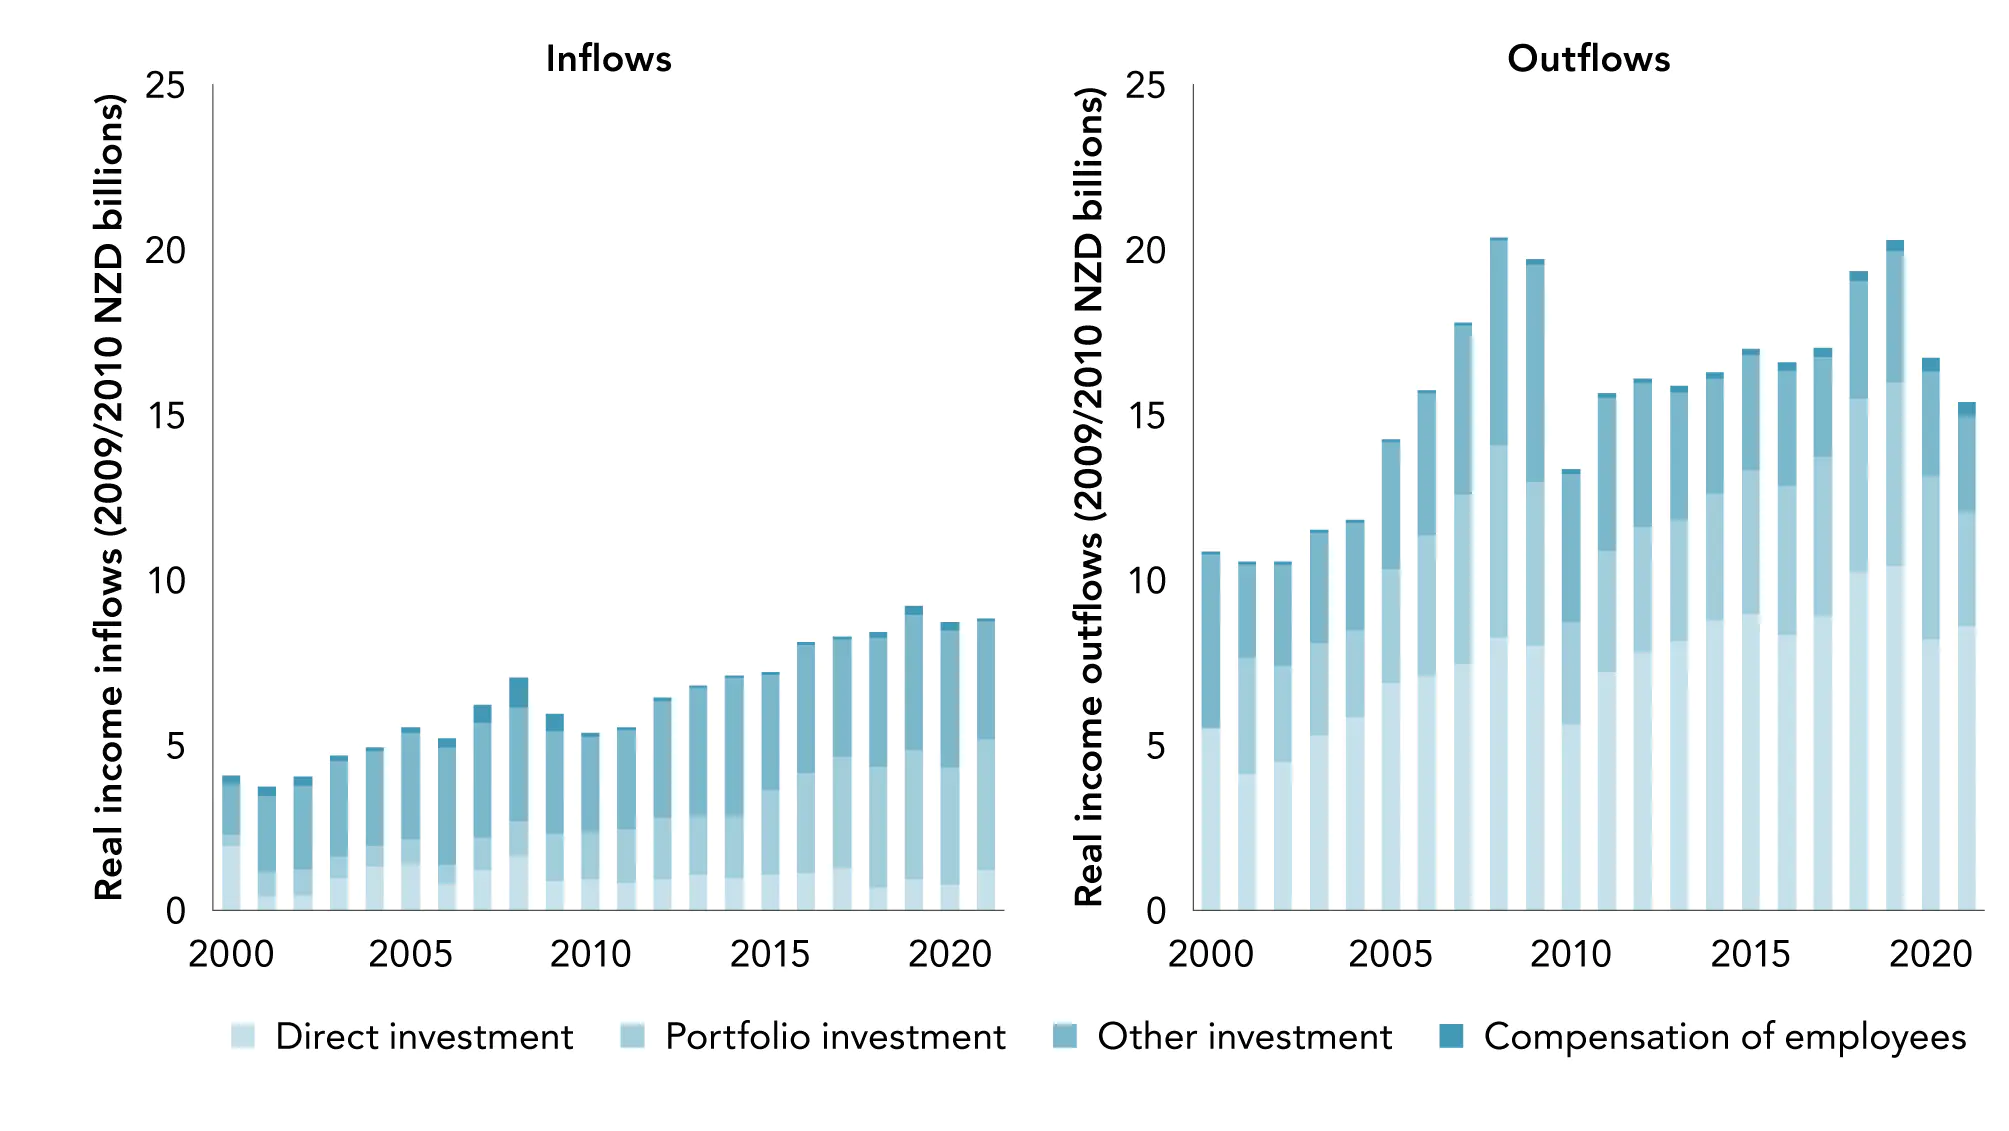
Source: New Zealand Productivity Commission analysis of Stats NZ Balance of Payments data.
Notes: Direct investment is a situation where a single investor owns 10% or more of voting shares in a company.
Portfolio investment is when an investor owns less than 10% of the voting shares of, or debt securities by, a company. It also includes borrowing and lending in the form debt securities.
Other investment comprises borrowing and lending using loans, trade finance and deposits (<10% ownership interest).
Compensation of employees comprises wages/salaries earned from providing labour.
Depreciation and income
Some of the income received by Aotearoa New Zealand needs to be reinvested to maintain our productive capacity.6 Net National Income (NNI) removes the value of depreciation of fixed assets from GNI to measure the income that New Zealanders have available to spend without decreasing our productive capacity in the future.7 New Zealand looks a little better than South Korea and Italy (countries with a higher gross national income) in terms of NNI (Figure 2.5), because it needs to pay less to maintain its productive capacity.
Figure 2.5 Gross vs Net National Income per capita, 2021
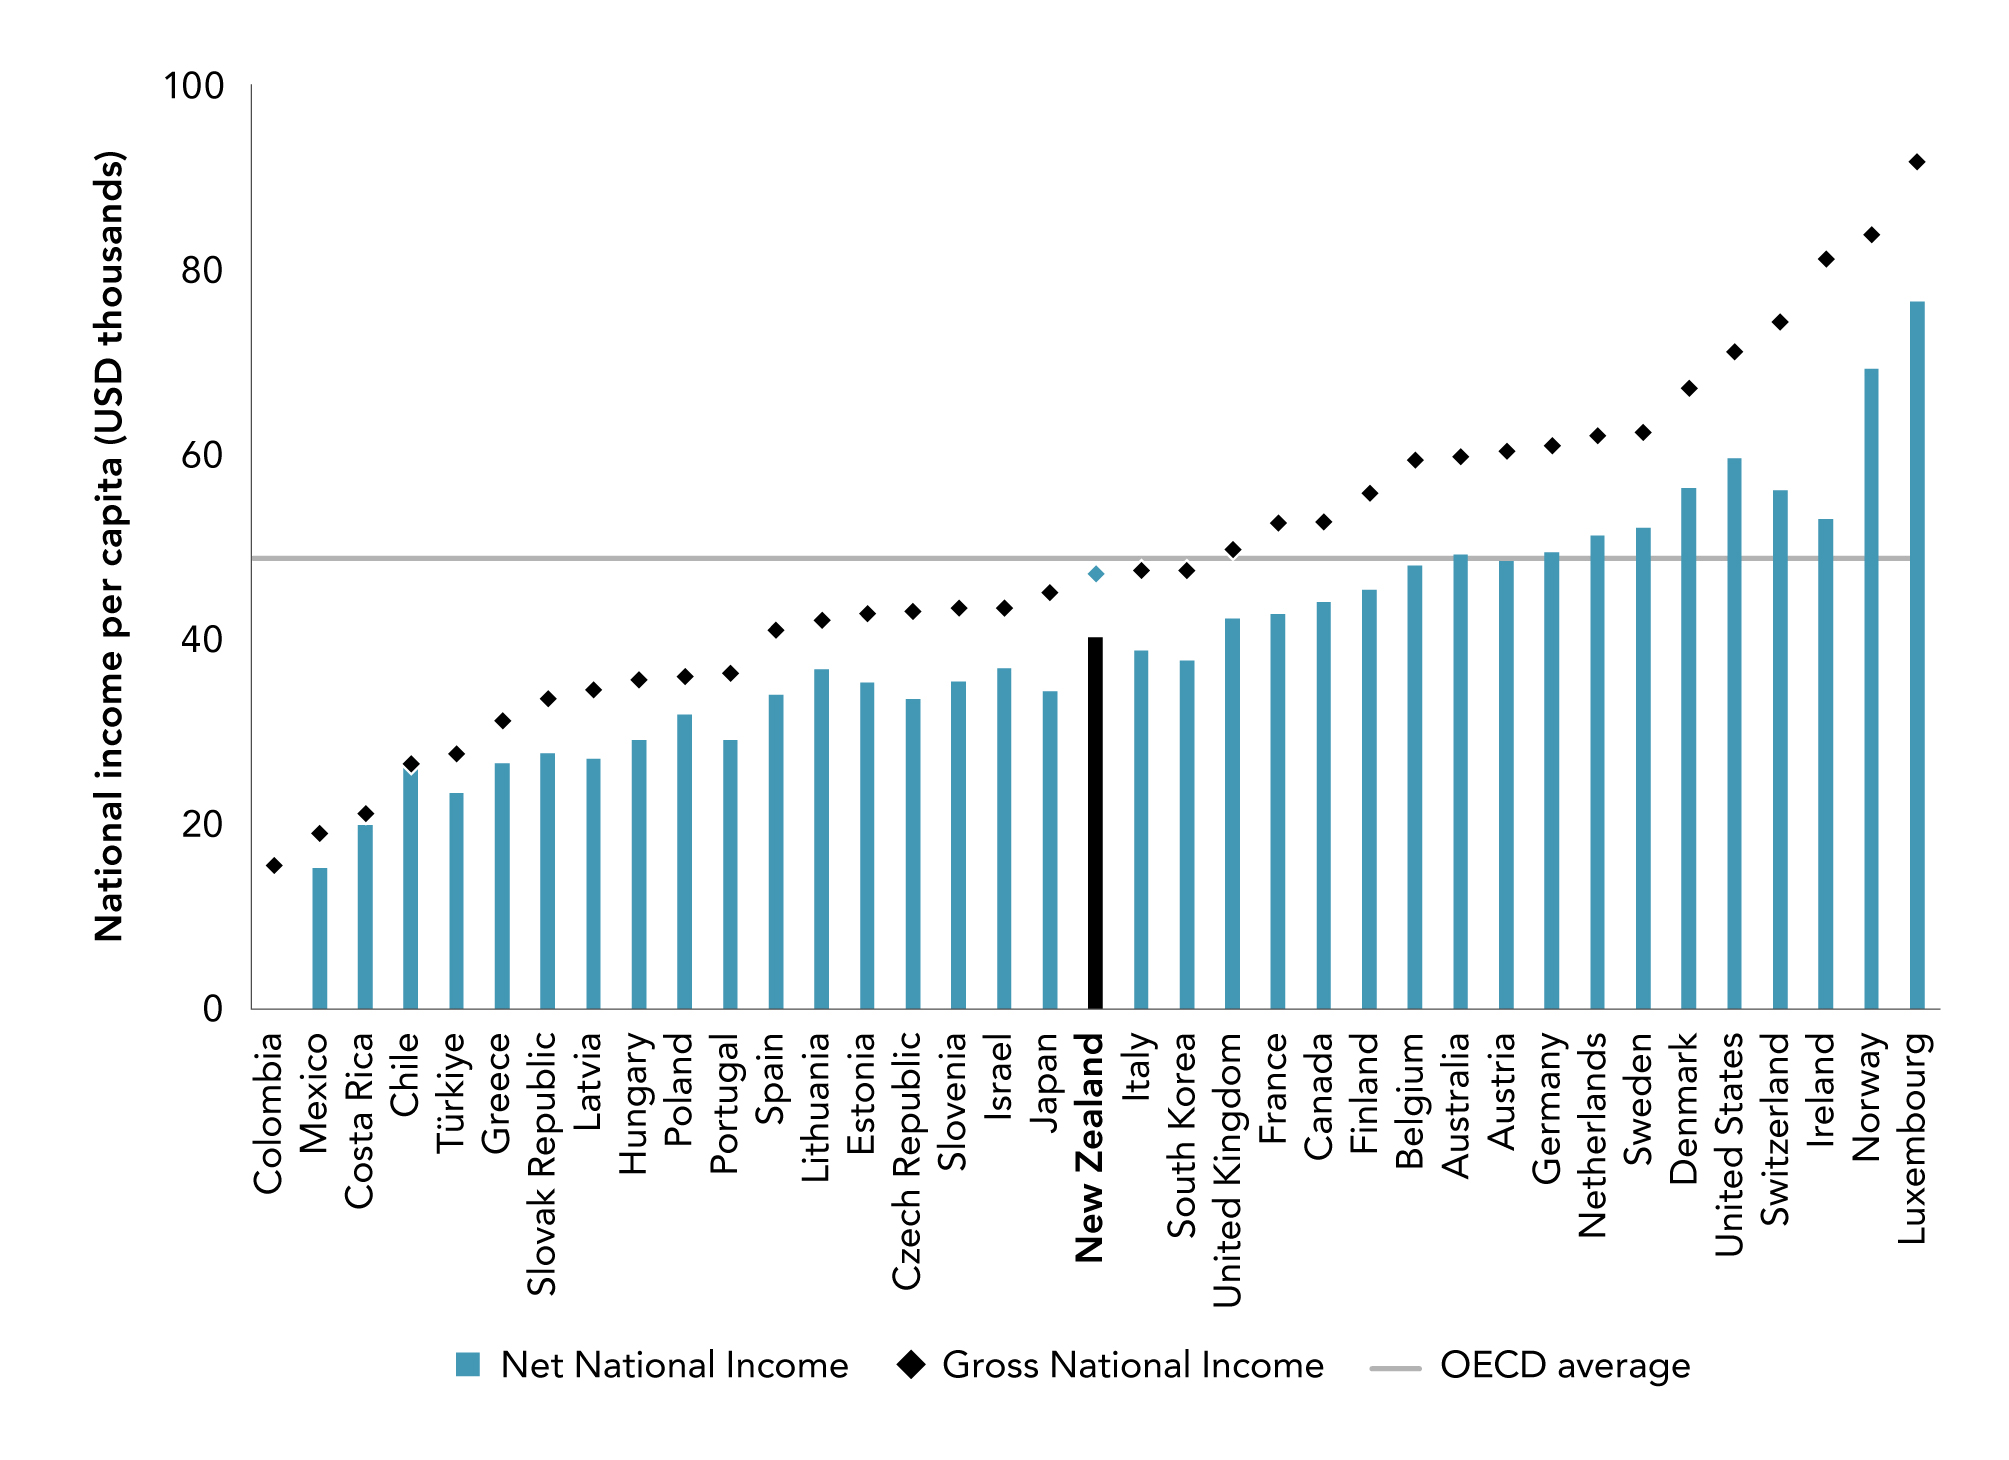
Source: New Zealand Productivity Commission calculations, based on OECD National Accounts Statistics.
Notes: Net National Income = Gross National Income less depreciation.
Figures are in current USD.
Figures are for 2021, except Colombia (2020) and Türkiye (2017).
2.2 Production, productivity, and material living standards
Economists have long emphasised that national product or income is not the same as wellbeing (for example, Kuznets, 1934). Box 2 provides a brief history of GDP. Understanding productivity, income growth, and their contribution to wellbeing is an important area of research, and there have been conceptual and methodological advances in recent years (for example, Asian Productivity Organization and OECD, 2021). As we noted in section 1.1 above, Treasury has developed a Living Standards Framework (LSF) for assessing the impacts of policy on wellbeing, based around how the broadly stated wealth of Aotearoa New Zealand and our institutions and governance relate to individual and collective wellbeing. Similarly, He Ara Waiora is a mātauranga Māori framing of wellbeing.
| Box 2 A brief history of GDP - from war to cooperation |
|---|
|
The history of GDP is a history of war, disasters, and taxation. The grandfather of national accounting, William Petty, grew up in a time of turmoil: the English Civil War, wars with Holland and France, plague, and famine. Petty was also born into a time when empiricism was also taking its first, tentative steps. He had been involved with possibly the first statistics publication, by his friend John Graunt (Graunt, 1676), which used mortality tables to create what has been described as the first “comprehensive picture of social and economic conditions” (Lepenies & Gaines, 2016, p. 13). For Petty, the task was to work out how much the British people could be taxed to support war with Holland and France. In an empirical counterpart to Adam Smith’s economic theory a century later, Petty believed – and showed – that Britain’s economic performance, including the value created by labour, was greater than suggested by traditional measures based on land ownership. He argued the growth of Britain was due to improvements in infrastructure, agricultural progress, and trade – not merely the acquisition of more land. Similarly, in the 20th century, when national accounting emerged in earnest, its two parents were similarly focused. In the United States, Simon Kuznets was asked by the government to calculate the capacity of the US economy to produce material required to enter the war with Japan and Germany. The gross national product “statistically demonstrated the transformation achieved by the American economy and the military successes” of Roosevelt’s “Victory Programme” to bring “opponents to their knees by producing massive amounts of armaments” (Lepenies & Gaines, 2016, p. 123). This work built on earlier work Kuznets had done as part of a battle against another national crisis, the Great Depression, when the government had cried out for a picture of the national economy. Across the Atlantic, James Meade and Richard Stone answered the call from John Maynard Keynes, down the corridor at HM Treasury, for better data on taxable income as a source of war finance. Keynes had written his grand opus – The General Theory of Employment, Interest and Money – in a response to Britain’s own Great Depression (Keynes, 1936). The Western Allies’ recovery plan from what became the Second World War included the founding of the Organisation for European Economic Cooperation (OEEC). As well as administering the Marshall Plan aid, and delivering the European Recovery Programme, the OEEC also produced the first Standardised System of National Accounts. This formed the basis of the United Nations System of National Accounts. Later, the OEEC evolved into the Organisation for Economic Cooperation and Development (OECD). Many of our international comparisons in this report are based on OECD data. |
Although wellbeing is a much broader concept than income or material living standards, our ability to produce and purchase the goods and services that we want, and need, remains a critical ingredient to overall wellbeing. Figure 2.6 is a stylised representation of how material living standards are primarily determined by a country’s ability to efficiently produce goods and services – both for domestic consumption and export to other countries. The role of world prices, terms of trade, and net foreign investment has been touched on above. In the remainder of this chapter, we discuss the factors underlying our ability to produce goods and services, with a focus on the methods and challenges for measuring productivity. In Part 3, we use these standard measures to describe Aotearoa New Zealand’s productivity performance in comparison to other countries and over time.
Figure 2.6 The drivers of material living standards
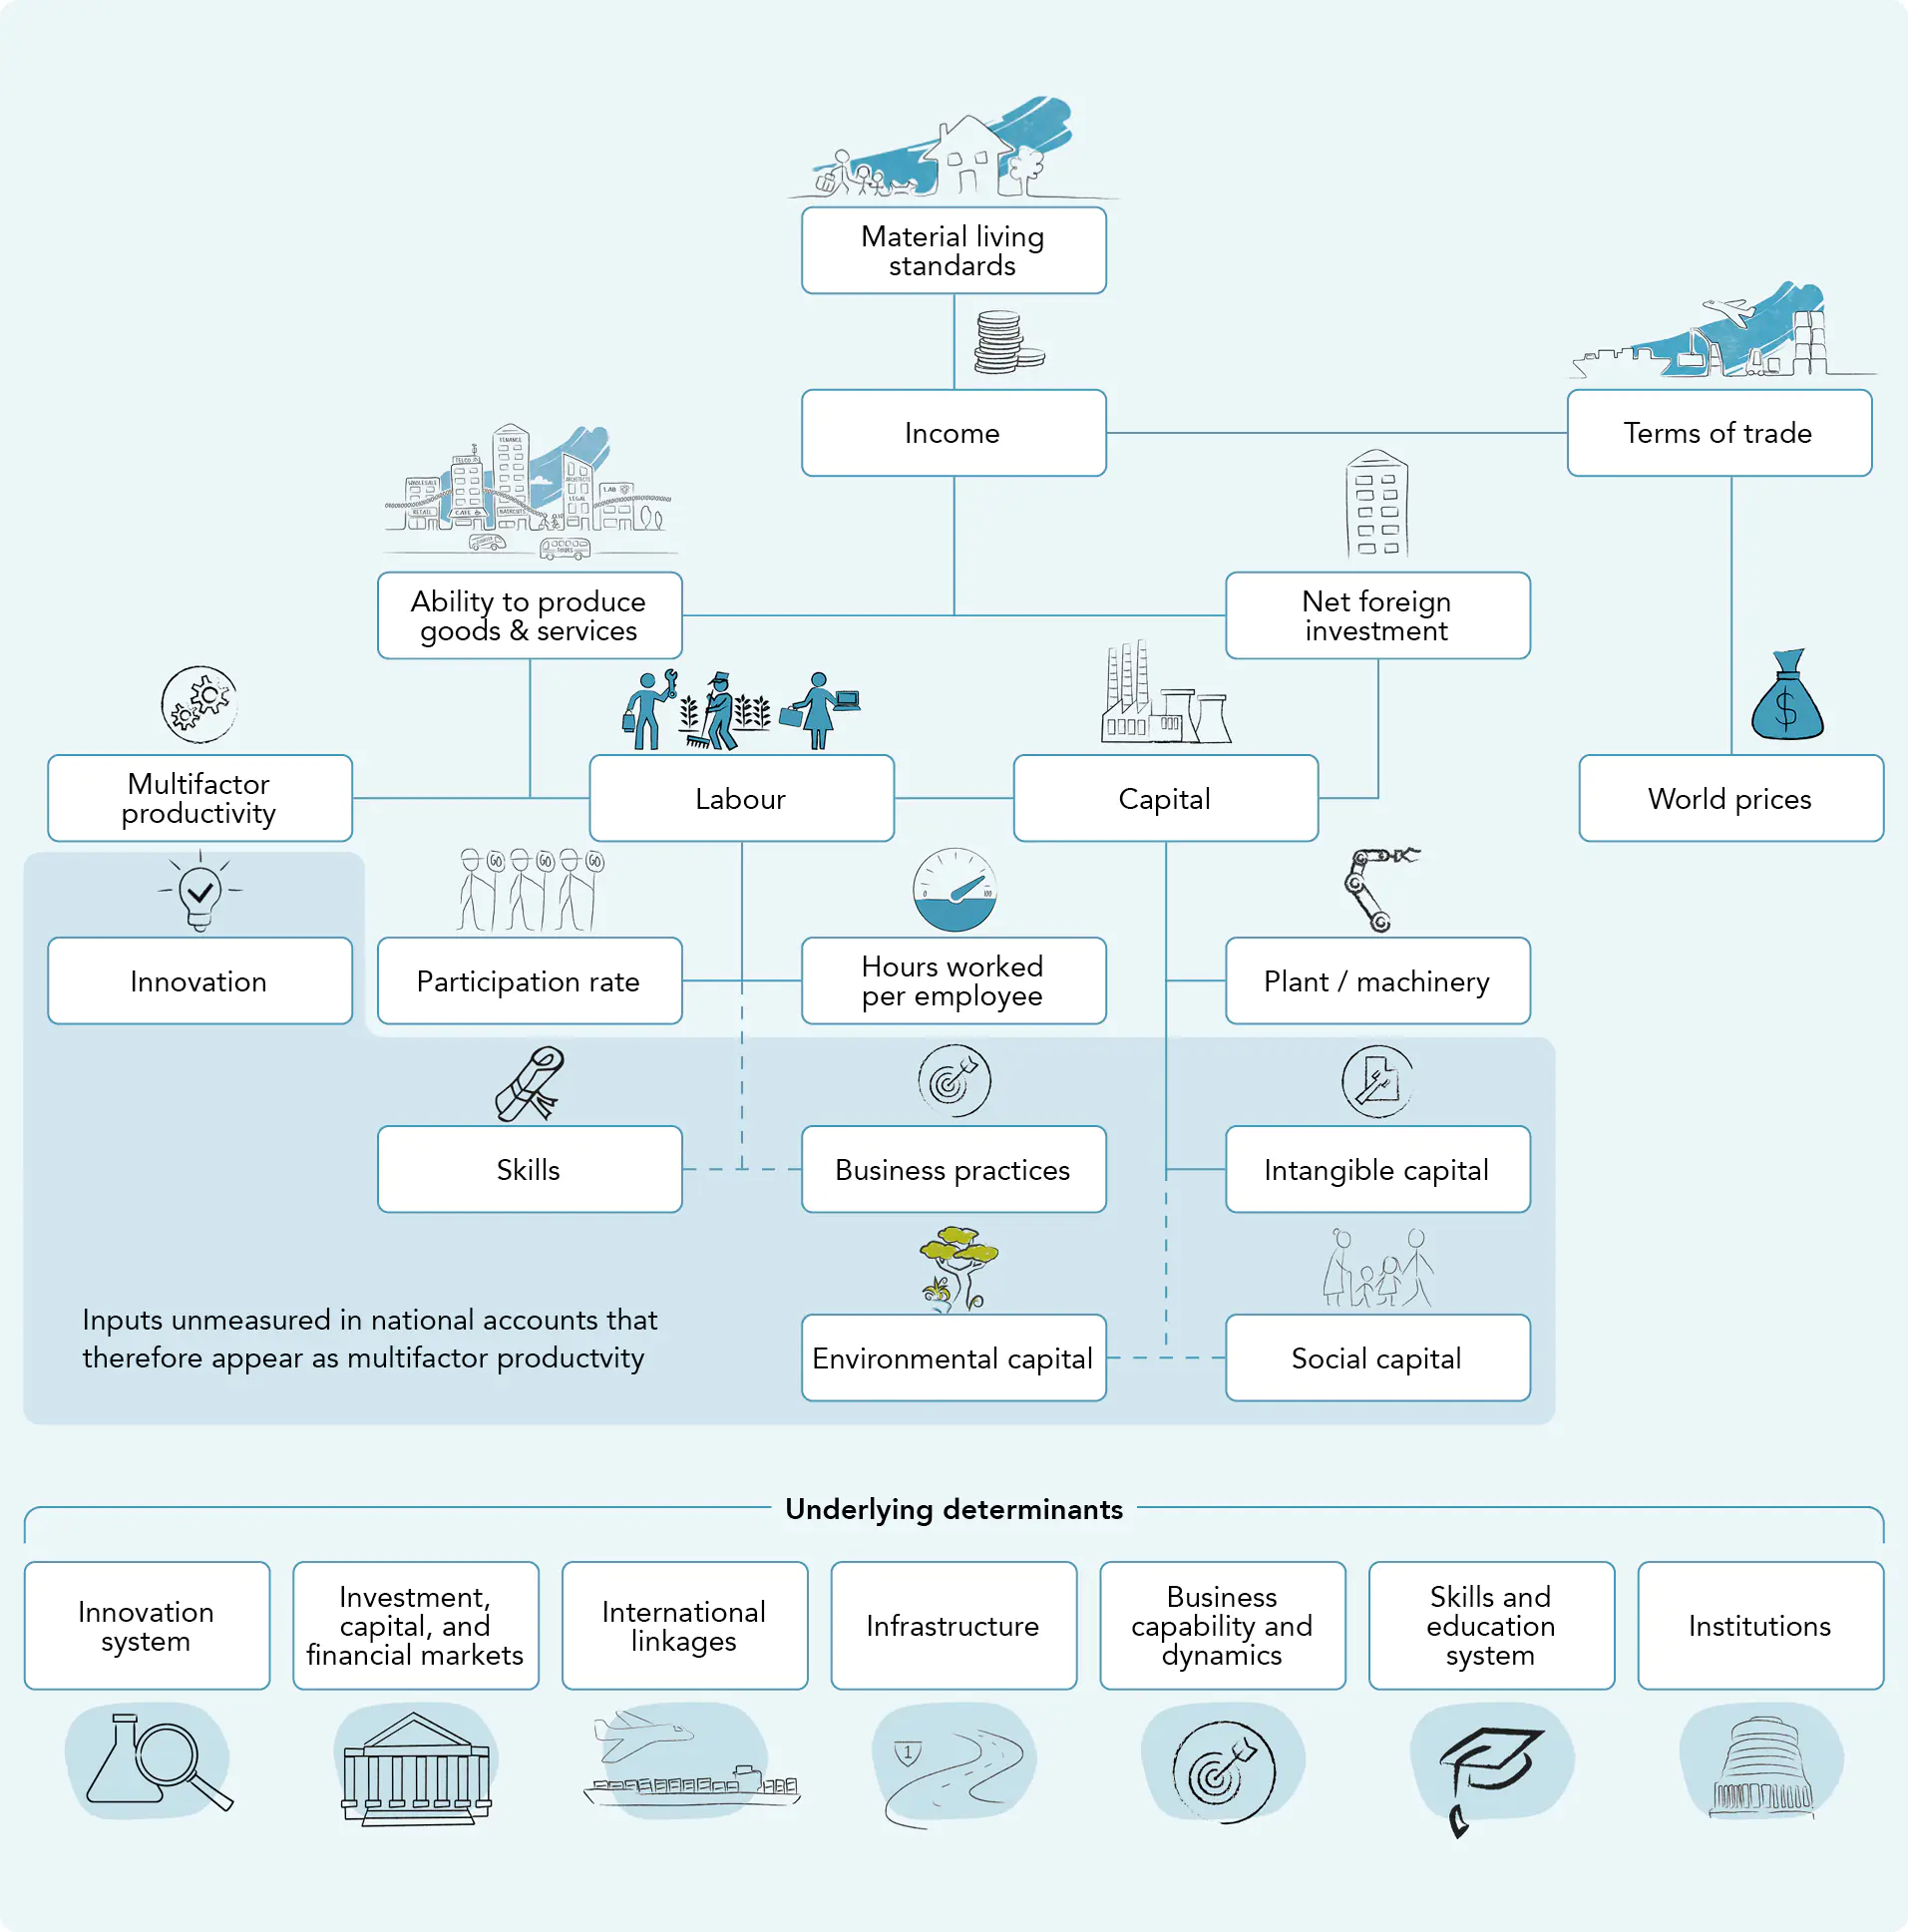
Goods and services are usually the most tangible and easily identified outputs from production. In the accounting framework used to measure national productivity, three factors determine how much output an economy can produce:
- the amount of labour;
- the amount of capital; and
- how well labour and capital are combined
Finding better ways of combining capital and labour to increase output is captured by multifactor productivity (MFP).8
Labour
A key determinant of a country’s ability to produce goods and services, and therefore attain higher material living standards, is labour (work). The degree to which labour produces goods and services is called labour productivity. Incomes can grow when:
- people already in employment work more (that is, put in more hours);
- people who have been unemployed gain paid work;
- people outside of the workforce gain paid work (that is, increases in the participation rate); or
- the volume of total goods and services sold increases faster than hours
Only the last point above is labour productivity growth. Over the longer term, the value of labour input can increase as the skills of the workforce increase. When labour productivity is measured using volumes of undifferentiated labour, such as in number of employees or hours, those increases appear as productivity growth (see Box 3 for more details on how labour input can be measured). As labour quality is hard to measure, national accounting practices focus on the quantity of labour employed.9 Therefore, productivity changes described in Part 3 will include changes in the skills of the workforce.
There are only so many hours in the day that people can work, and long working hours can contribute to stress and other harm. People also value things other than work, such as leisure and spending time with family.
Growing material living standards by increasing working hours has its limits.
Figure 2.7 compares Aotearoa New Zealand with other OECD countries, showing that New Zealanders work more hours but achieve less output per hour than in many typical comparator countries. This is despite the expansion of the OECD to include many less-developed countries with lower incomes and more working hours than earlier member countries.
| Box 3 Measuring labour input |
|---|
|
An ideal measure of labour input is the actual labour services provided, which will depend on the amount of labour that is supplied, the intensity with which the labour is delivered, and the skills of the worker. The most basic measure of labour input is the number of employees. This has the benefit of being simple to measure but gives only a rough indication of the amount of labour used. The number of employees can vary over the year, as in seasonal work in agriculture or tourism, and not all workers work full time. Another common measure is hours worked, which accounts for variation across workers and across time to provide a more precise measure of the volume of labour input. Hours over which labour input is supplied can be difficult to measure. Often it is easier to measure which hours are contracted, or hours paid. But hours can vary (for example, because of overtime, sick leave, national holidays and vacations). Typically, these are measured using nationally representative labour force surveys. Another distinction is between actual hours and usual hours worked. Ideally, we would be able to see all the hours actually worked by all workers. However, events like sick days, overtime and holidays are not only rare events, but they may also reduce the likelihood of a worker being surveyed. Many countries’ statistical agencies base statistics on usual hours worked and ask respondents to take these variations into account. Recent research has questioned the actual hours measure (Janssen et al., 2022; Ward et al., 2018). This assumes that survey respondents are not accurate when reporting their hours worked, failing to account for variations such as annual and sick leave. Recent research by the Productivity Commission (Fabling, forthcoming) examined the case against using the current aggregate hours-worked labour series in Aotearoa New Zealand. Fabling found that the current series behaved sensibly when statutory minimum annual leave provisions changed. At the worker level, linked employer–employee data imply leave accrual is a substantial issue for alternative approaches that rely on assumptions about leave. Fabling’s findings support the ongoing use of self-reported hours worked in New Zealand – particularly during events like the COVID-19 pandemic, when it may be hard to justify a constant macro-adjustment approach. Because their adjustment essentially replaces once presumed bias with another, and there is no clear evidence, Figure 2.7 excludes countries for which the “simplified component” method has been applied. This means that we are comparing data produced in the same manner. At the firm level, we can also measure labour inputs using administrative data. Full-time equivalent (FTE) employment calculates the amount of labour relative to a “normal” working week. This can be based on hours, or a part-time vs full-time split. Rolling mean employment (RME) accounts for variation in employment over the period studied (typically the calendar or financial year). In the Integrated Data Infrastructure and Longitudinal Business Database, for example, the number of employees at each firm is captured through monthly and payday PAYE tax returns. Some analyses make a quality adjustment of labour inputs, to account for the different skills of workers (for example, Maré et al., 2017). Accounting for labour quality is usually done in a national accounting context by weighting headcounts or hours worked of different skills (typically by qualification) by their relative wages (for example, Mason & Osborne, 2007). |
Figure 2.7 New Zealanders work longer hours and get less output per hour than most OECD countries
Hours worked per year vs output per hour relative to the OECD average, 2019
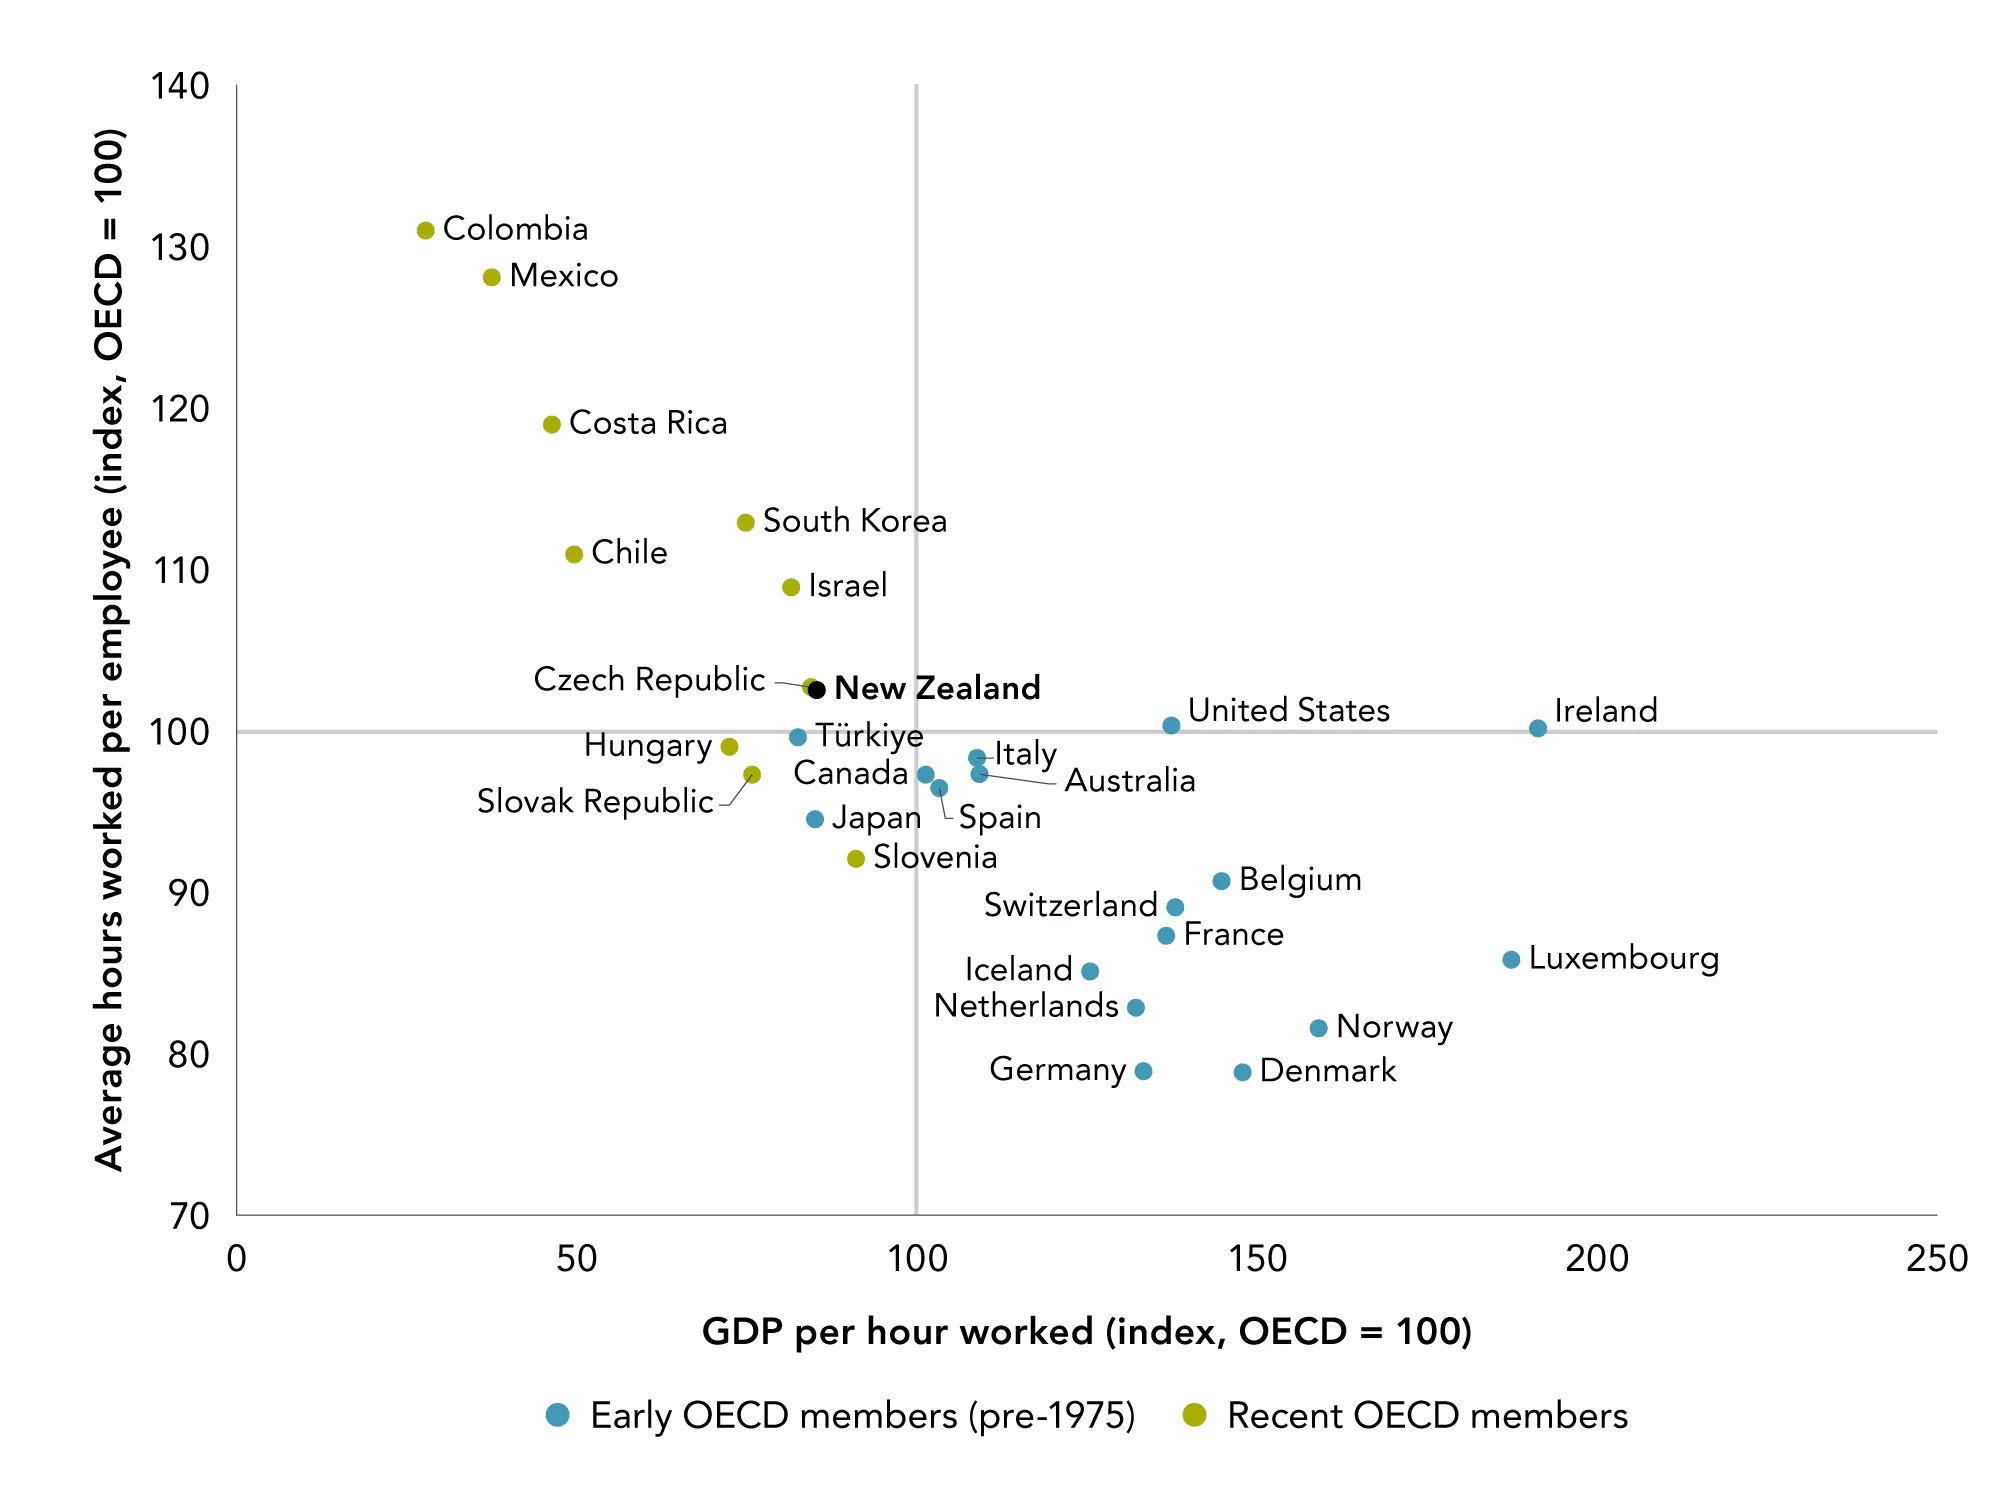
Source: OECD Productivity Database.
Notes: Figures are relative to the OECD average. GDP per hour worked (index, OECD = 100) estimated for Australia. Average hours worked per person employed (index, OECD = 100) estimated for Australia. Excludes countries for which the OECD applies the simplified component method for hours worked (Ward et al., 2018).
Capital
In the measurement of productivity, “capital” refers to physical and intangible assets – the equipment and structures that are used in the production of goods and services. Examples include computers, machinery, vehicles, software, and buildings. These assets provide firms with a flow of services over time, rather than being used up in the production process. Conceptually, capital also includes elements such as institutional, social, environmental and knowledge capital. These are more difficult to measure, but developments have been made in these areas (see Box 5). National accounts separate produced capital (like machinery and buildings) from non-produced capital (like land), which is not produced by human investments (except in some specific examples). Land is treated as an asset in the national accounts, and it includes the ground (including the soil covering it and any associated surface waters) and major improvements that cannot be physically separated from the land itself. It excludes any buildings or other structures situated on it or running through it, which appear as produced capital.
Introducing new capital can increase the relative volume or value of output by replacing labour, reduce the costs of production, make workers more productive, or allow new goods and services to be created (NZPC, 2020b). Aotearoa New Zealand firms are, by the standards of other developed countries, capital shallow, meaning workers have relatively limited equipment to work with (NZPC, 2020a). The accumulation of more and better capital equipment per worker over time is known as “capital deepening”. Using domestic savings and international borrowing to invest in productive capital assets makes workers more productive, increasing labour productivity.
Although labour and capital are treated as separate inputs to producing goods and services in Figure 2.6, they do not operate in isolation. For example, the availability of labour can affect the decisions made by firms on whether to invest in capital. In areas where labour is scarce or otherwise very costly, firms may invest more heavily in technology to meet their production goals. One example is in Japan, where an ageing population, declining workforce, and limited inflows of migrants have created strong incentives for firms to automate (Schneider et al., 2018).
Multifactor productivity
In addition to increasing the supply of capital and labour, firms can improve how their workers make use of their skills, equipment, and other inputs. This is captured as MFP, which measures the overall efficiency with which all the measured inputs combine to produce the measured outputs.
When all inputs in the production process are measured and accounted for, MFP growth can be interpreted as the amount of growth in real output that is not explained by the growth in inputs.
The residual – the part that is not explained by growth in inputs – has been described as a “measure of our ignorance” (Abramovitz, 1956), because many of the inputs in the production process are difficult to measure. As technology advances, this is likely to increase, at least while national accounting standards catch up.
Although increases in MFP are commonly referred to as “technical change” or improvements in efficiency, there are many possible sources of MFP growth. They are more accurately interpreted as some combination of technological progress, efficiency gain, unobserved change in capacity utilisation, and measurement error (see Appendix for more detail). These components are considered in the following sections of this chapter and in more detail in the introduction to Part 4.
MFP is most useful as a measure of productivity growth over a whole economic (or “growth”) cycle, as annual movements in measured MFP can be volatile and do not necessarily represent true changes to underlying productive capacity.10 When estimating MFP growth, capital utilisation is usually assumed to remain constant, but when there is a sudden drop in demand, firms may choose not to sell capital rather than to use it less. Particularly relevant for Aotearoa New Zealand is variation in the weather, which can affect primary production volumes and the utilisation of processing capacity. Stats NZ has made specific adjustments to its assumptions about capital utilisation over the period of the COVID-19 pandemic, which is discussed in section 3.4 below.
The long-run drivers of MFP stem from using technology and skills in new and innovative ways. Innovation is an inherently risky long-run game. Being entrepreneurial and making continual investments to maintain, improve and adapt skills, equipment and technology are key to improving performance and national productivity. Firms that are successful in the long term have learned lessons in many ways: from business schools as well as the school of hard knocks, from previous experiences of success (and failure), by observation, and through trial and error. For example, we found in our New Zealand Firms: Reaching for the frontier inquiry (NZPC, 2020a) that kaupapa Māori firms and enterprises adopting long-term intergenerational perspectives can offer lessons for other firms looking to maximise lasting value. Some of these lessons are discussed in Box 10 of Part 5.
Considering these factors, MFP measures should only be used for longer-term productivity analysis. We must also be careful when making cross-country comparisons using MFP, as quite strict assumptions need to be made.11 Consequently, most studies across countries use labour productivity as the metric for comparison.
2.3 Recognising the limitations of standard productivity measures
Productivity measures are a powerful tool for investigating the nature and sources of growth in material living standards. However, there are limitations to be considered, especially when using these measures to inform policy.
What is in and what is out often depends on what can be easily measured
Stats NZ’s productivity statistics cover the “measured sector”, which comprises predominantly market industries. The measured sector covers approximately 80% of Aotearoa New Zealand’s GDP and cuts across the three main sectors of the economy (that is, primary, goods-producing and services).12
In Aotearoa New Zealand, the quantity of labour for businesses is measured by hours paid, not hours worked, so our productivity measures exclude unpaid household, community and voluntary work – all of which can contribute to individual, family, and social wellbeing (Waring & Steinem, 1988). Measuring these activities requires gathering information about how people spend their time (rather than their money), which is information last collected by Stats NZ in 2010. This is a gap in measurement, and it is important to acknowledge that although a large proportion of material living standards result from market exchange, a large proportion also results from household production and community enterprise.
Official productivity statistics also exclude most public services or measure them in different ways than services provided by the market are measured. Collective goods and services, such as population or sub-population public health initiatives, are especially hard to measure. Where public services are free or only nominally charged, measurement would underestimate their value to recipients.
Many government services are not captured by official productivity measures.
National accounts have traditionally valued public sector outputs at the cost of their production, such that productivity growth will appear as zero, by definition, for many government services.
There have been several attempts in Aotearoa New Zealand and overseas to improve the measurement of public services and their productivity. In 2010, Stats NZ published a feasibility study for measuring publicly provided health and education sector productivity in New Zealand and concluded it was feasible to estimate productivity performance over time in a similar manner to that in the measured sector. We present long-term trends in New Zealand’s health and education sector productivity in Part 3.
It is important to adjust for changes in the quality of services provided
The education and health productivity measures published by Stats NZ are significant improvements over past practice, but they do not capture all changes in the quality of public services. Stats NZ numbers simply measure changes in the volume of outputs: cost-weighted equivalent full-time students for education, and cost-weighted inpatient and day-patient hospital events for healthcare. They can show the influence of production shifting from lower- to higher-value output if the weights account for differences in quality,13 but they do not show whether schools have become more effective at teaching, or whether hospitals are better at healing people.
Quality adjustment therefore matters for providing a more complete picture of public sector productivity. There are techniques available for adjusting public sector productivity data to reflect changes in the quality of services. Several case studies were explored in our Improving state sector productivity inquiry (NZPC, 2018a). In the case of the education sector, Gemmell et al., (2017) tested a range of quality adjustments to productivity estimates for Aotearoa New Zealand’s schools, based on sector-level data. They found that the most reliable adjustments provided a broadly consistent picture of flat or declining measured productivity in the school sector.
Adjusting for quality is also important to better understand productivity growth in market industries. For example, the current labour measures may not fully capture changes in skill levels within the workforce (that is, the “quality” of labour, or “human capital”). This will underestimate labour productivity growth, and over-report MFP growth, if the quality of the labour force is increasing. As noted above, there are techniques for adjusting market industry labour data to reflect changes in the skill composition of the workforce and therefore better identify how “quality” improvements have contributed to productivity growth (McNaughton, 2008).
Significant gaps in the measurement of inputs remain
There are also gaps measuring capital input. Official measures of capital focus on physical assets valued at market prices. However, estimating capital accumulation with market prices can miss spillovers and network effects from new capital investment. Intangible assets like knowledge, technology, ideas in development, reputation and brands are not all measured as capital and instead are captured within the MFP “residual” (see Box 4). They are identified, but they are conflated with other influences on MFP, making it difficult to understand the issues and design appropriate policy.
| Box 4 Innovation, research and development, and intangible capital |
|---|
|
Research and development (R&D), and other investments in innovative activity, create knowledge or intangible capital that can be used to produce output more efficiently. However, the inputs used to create this knowledge are often indistinguishable from the capital, intermediates and labour inputs directed towards current production. Therefore, inputs will be overstated during periods of heavy investment in intangibles (such as adapting business practices to accommodate new technologies), leading to apparent low productivity growth. As this new but unobserved intangible capital bears fruit, productivity growth will be overstated, as measured output increases (Brynjolfsson et al., 2019, 2021). Corrado et al. (2022) calculated that current national accounting measures of intangibles pick up about two-thirds of total intangible investment (see Figure 2.8). Their calculations – using the EU KLEMS and INTANProd datasets14 – suggest that private investment in intangibles is around twice as high as private tangible investment in property, plant, and equipment (16.8% vs 8.5% of GDP). They also described the mechanisms where incorrect classification of inputs and outputs of intangibles bias our measures of productivity. As well as the direct effect, the non-rival nature of knowledge means it can disperse (or “spill over”),15 so around one-fifth of intangible capital translates into gains in multifactor productivity (in a similar way to measured R&D investments). |
Figure 2.8 Intangible capital: Broad categories and types of investment
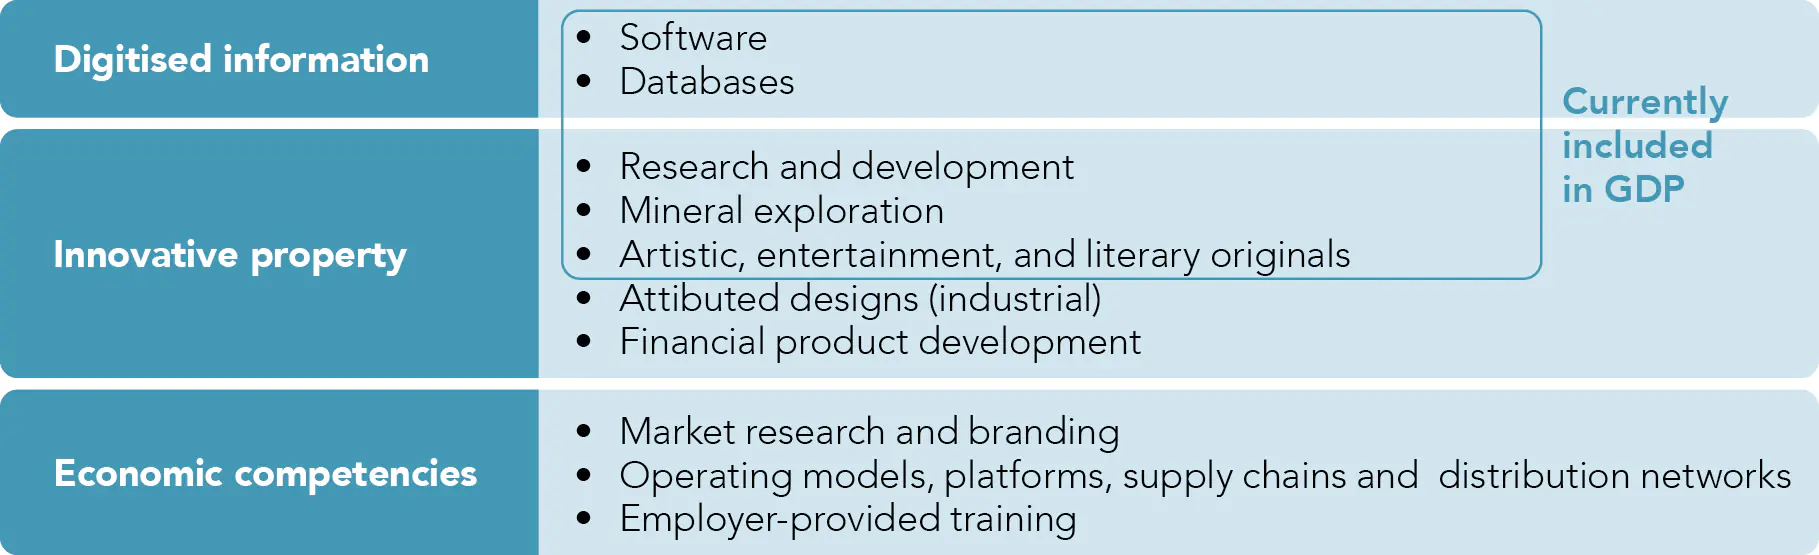
Source: Corrado et al. (2022)
Other factors that matter for productivity growth and wellbeing are either not directly measured or only partially captured in the MFP “residual”. These include social capital (such as levels of trust among citizens and the quality of our institutions) and natural capital (from which people draw the ecosystem services the environment provides). A risk of not explicitly incorporating these capitals is that degradation may go unnoticed and true economic growth and productivity will be overstated.
As part of its LSF work (discussed in section 1.1 above), Treasury includes aspects of factors such as cultural capability and belonging, the natural environment and environmental amenity in its dashboard of indicators (Hughes et al., 2022; The Treasury, 2022). Others have integrated them explicitly into their measures of productivity (Grimes & Wu, 2022).
For example, mismeasured economic growth achieved through environmental depletion reduces the total capital available for future years and the potential wellbeing of future generations. A recent review of the economics of biodiversity conducted for the UK Treasury illustrates this point starkly.
Estimates show that between 1992 and 2014, produced capital per person doubled, and human capital per person increased by about 13% globally; but the stock of natural capital per person declined by nearly 40%.
Professor Sir Partha Dasgupta, The economics of biodiversity, 2021, page 114
The Asian Productivity Organization (APO) and the OECD have noted that “an accurate estimation of output and input measures is key for the appropriate measurement of MFP” (2021, p. 83). They have recently recommended adding several environmental productivity indicators to official statistics sets (Box 5).
| Box 5 Options for measuring environmental productivity |
|---|
|
Challenges in measuring outputs
One manifestation of technological progress that has challenged the measurement of outputs is the digitalisation of goods and services.
- The rise of internet streaming services has largely replaced the purchase of CDs, LPs and other physical music media (APC & NZPC, 2019).
- High-quality cameras and photo-editing tools now come bundled with smartphones, rather than as separate products.
- Online tools now allow “more and more households to provide services to themselves that used to be produced by private companies. For example, households are now able to use search engines and travel websites to book flights and plan holidays, while this would previously have required a dedicated travel agent” (APO & OECD, 2021, 22).
- Rapid increases in computer processing and internet download speeds can make it difficult to measure the value of the services they provide over time (for example, a smartphone from 2015 is arguably not comparable to a smartphone which uses 5G technology in 2023).
Adjustments may therefore be needed on the output side to ensure productivity statistics reflect technological progress, which have changed the quality and nature of the goods and services over time to be more service-like. Baumol’s “cost disease” is the idea that the inability of some labour-intensive activities to substitute labour with technology (capital) would cause costs in such activities to rise over time, relative to other activities (Baumol, 1996). Baumol also argued that productivity growth is elusive in service industries, because services are poorly suited to standardisation and (by implication) to substitution by technology, and because their quality depends (or is thought to depend) on the amount of human labour they involve (Baumol, 1993).
Any potential improvements in digital goods and services will be challenging to measure because it is difficult to identify standardised outputs and prices. Each of these new industries will have unique problems, which in turn depend on how one measures intangibility, quality and interaction with inputs provided by consumers of the service.
Future directions for research and measurement are discussed in Part 5.
5 In this context, prices contain two components. One is important information about the relative value of current and new products and services. The other is merely a nominal one that needs to be removed in analyses such as this. We need to distinguish the changes that are due simply to a general increase in prices (that is, inflation) from changes that come from a substitution to more valuable goods and services, or the introduction of new or improved ones.
6 This is sometimes called “Hicksian income” because of the three measures of income set out by Hicks (1946, 173–174).
7 Currently, national accounts only accounts for certain types of produced capital, but it is feasible to extend this to include other assets that need to be maintained, such as the environment (Brekke, 1997; Grimes & Wu, 2022; Pearce & Atkinson, 1995).
8 This is sometimes called total factor productivity (TFP). However, since this implies that we have measured all the factors determining production and this is all that is left, we prefer the term multi-factor productivity, to distinguish it from single input measures such as labour productivity.
9 Stats NZ produces a “composition-adjusted” measure of labour, but it is not currently used in productivity estimates.
10 In Productivity by the numbers ‘growth cycles’ have been determined using statistical techniques and chosen to represent high points in capacity utilisation of the See Stats NZ (2020), ‘Productivity statistics: 1978–2020’ https://www.stats.govt.nz/ information-releases/productivity-statistics-1978-2022/ and Stats NZ (2007), ‘Extracting Growth Cycles from Productivity Indexes’.
11 One must always be careful to read the footnotes in such comparisons.
12 The former measured sector (MS-11) is available for the period from 1978 onwards and includes: Agriculture; Mining; Manufacturing; Electricity, Gas, Water and Waste Services; Construction; Wholesale Trade; Retail Trade; Accommodation and Food Services; Transport, Postal and Warehousing; Information Media and Telecommunications; and Financial and Insurance Services. The more recent measured sector (MS-16) starts in 1996 and includes the sectors in the MS-11, plus: Rental, Hiring and Real Estate; Professional, Scientific and Technical Services; Administrative and Support Services; Arts and Recreation Services; and Other Services.
13 In the case of cost weighting, this assumes the relative costs reflect the value society places on differences in This may be appropriate when better, more expensive ways of serving the public replace less expensive ones. However, in many cases, quality improvements can come through cost-saving innovations that also increase quality. For example, keyhole surgery can be cheaper, provide a better patient experience and be less risky than more invasive surgery.
14 EU KLEMS stands for EU level analysis of capital (K), labour (L), energy (E), materials (M) and service (S) The dataset also includes data for Japan, the UK and the US. INTANProd stands for Intangible Production, with information on investment and capital stocks for intangible assets that are not included in the national accounts. For more information see: https://euklems-intanprod-llee.luiss.it/
15 We discuss how innovation affects the economy in more detail in Part 4.