At an aggregate level, productivity growth improves material living standards. However, it does not follow that everyone’s individual wellbeing, material living standards, income or consumption improve with higher productivity.
Governments play an important role in supporting economic inclusion and determining how the benefits of greater productivity are shared
Even when economies are performing well, the process of productivity growth can be painful. When market shares or resources move from less productive to more productive firms and industries – with some closing or shrinking, and others opening or expanding – some people benefit from new opportunities and higher incomes, while others experience disruption and job uncertainty. Public policy has an important role to play to ensure that the gains of productivity growth are shared, and that the pains do not fall disproportionately on those worst off, or those who have least ability to influence decisions that affect them.
Unequal outcomes can affect wellbeing directly. They can also reduce future wellbeing through their impact on productivity. If poor families cannot afford quality housing, this has a direct effect on their wellbeing as well as longer-term effects on their ability to work or attend school. Work by Riggs et al. (2021) suggests that overcrowded, cold, damp or mouldy homes led to an average of 6,000 hospital admissions annually between 2010 and 2017, with an estimated cost of $36 million per year. These direct costs may be dwarfed by the impact of time away from work or school. For example, falling behind at school reduces options later in life and reduces future productivity and earnings.3
What is the potential for regressive impacts?
Aggregate productivity measures do not tell us much about how the benefits of productivity are distributed. Other measures can give us a broader picture, but interpreting these is difficult (Box 1).
Productivity growth can be an important levelling force. When economies underperform, it is typically the least skilled, qualified or experienced people, and those with the fewest social and economic resources, who are worst affected. Inequalities tend to increase where productivity growth is weak, because some people have fewer options than others (Hoynes et al., 2012; OECD, 2015). People with high or above-average educational attainment, and those starting life with a lot of resources, have more opportunities and may be more able to adjust or relocate to find more productive, higher paying jobs.
| Box 1 Productivity measures reveal little about the distribution of material living standards |
|
Who gains from productivity growth? The labour income share (LIS) is one way of measuring how productivity gains are allocated; it indicates how national income is split across inputs to production. There are two reasons to focus on the LIS. The first is that labour is the main source of income for most of the population. The second is because it is the simplest to measure, as most payments to labour are directly observable.4 The difficulty comes in interpreting the remainder. Most of the remaining part of national income is generally considered to be the return to capital expected under perfectly competitive conditions, sometimes called the capital income share. However, this residual could also be due to an increase in firms’ market power leading to higher economic profits; the undermeasurement of capital because of assumptions about depreciation and obsolescence, or unmeasured capital such as intangible or organisational capital; or the emergence of a gap between the return on risk-free bonds and the cost of capital that firms perceive when making their investment decisions (Karabarbounis & Neiman, 2019).
There have been long-term declines in the LIS across the world, particularly since the Global Financial Crisis (GFC) (Karabarbounis & Neiman, 2014; Piketty, 2018; Stansbury & Summers, 2020). This has led to concerns about growing inequality and whether the benefits of economic growth are being widely shared.
Most studies of the LIS in Aotearoa New Zealand have focused on the period since the 1970s, showing a long period of decline in the labour share through to the early 2000s, followed by a period of recovery (Bridgman & Greenaway-McGrevy, 2018; Conway et al., 2015; Reddell, 2017) until declining again from 2009. In contrast, Partridge & Wilkinson (2019) argued that the decline halted in 1991, after which the LIS again trended upwards. Bertram & Rosenberg (2022) and Rosenberg (2017) took a longer-term perspective, showing that the declines since the 1980s followed a long period of increasing LIS in the post-war period. The long-term picture places the current LIS at higher than it was 80 years ago, but lower than it was in 1981.
Bridgman & Greenaway-McGrevy (2018) attributed the decline since the mid-1980s to the decline in public sector employment as government trading enterprises were corporatised as part of public sector reforms. Bertram & Rosenberg (2022) tackled the apparent lack of impact of the Employment Contracts Act 1991 on the falling labour share. They found that a decline in real wage rates coincided with a rise in employment and reversal of high unemployment, which peaked at 11% in the year to March 1992. When the employment rate is considered, there was a statistically significant structural break in that year. This is consistent with significant reductions in employee bargaining power and social supports (which occurred in the same period). Allan & Maré (2022) found evidence of significant economic rents using firm-level data from 2002–2018 and found that economic rents accrue primarily to owners of capital rather than to labour.
Recent developments have enabled sophisticated decompositions of the changes in the labour share. For example, Karabarbounis & Neiman (2019) found that half of the decline in the global labour share can explained by the shift away from labour caused by the decrease in the relative price of investment goods (such as information technology). Barkai (2020) found a falling capital income share, but this was more than made up by rising pure profits which he considered to be the primary explanation for the fall in the US labour share. Finally, De Loecker et al. (2020) found rising average economic rents since the 1980s are due not to firms raising their profit shares, rather, they are due to the reallocation of economic activity to more profitable firms (in what has been called the rise of “superstar firms”) (Autor et al., 2020).
A decline in the LIS is not necessarily evidence of falling material living standards at the lower end of the income distribution. Indeed, in many countries, mean wages have been rising, but median wages have been stagnating. This implies an increase in inequality within the labour share. Evidence suggests that this is due to a mixture of increasing returns to skills and allocation of labour to high-productivity firms, rather than the LIS declining in the average firm (Autor et al., 2020). There have been a vast array of reasons given for this, from the decline of unionism to increased use of robots (Grossman & Oberfield, 2022).
If productivity growth is fast enough, real wages could still be rising at a reasonable pace, even when the LIS is falling. This may be preferable to an economy in which the LIS is constant because real wages and productivity are both stagnating. On the other hand, growing inequality could lead to social consequences and resistance to change – which itself can hold back productivity growth.
|
Weak productivity performance may affect low-income consumers more than high-income consumers. Productivity growth typically makes goods and services cheaper, better, or both – freeing up money for other purposes. Conversely, where poor productivity results in higher prices for significant items of household expenditure, this imposes a larger burden on the budgets of those who are less well off.
Another aspect of productivity growth that may affect the distribution of income is the nature of technological change. Some technology substitutes for skills – such as mechanical looms replacing stocking knitters, and generative AI writing company reports (Johnson, 2023). Other technology increases the demand for skills, or “skill-biased technical change” (Autor et al., 2003; Card & Lemieux, 2001). If the substitution effect dominates, then the effect will be to compress the wage distribution. If skill-biased technical change dominates, the effect will be to increase inequality. The results of empirical work are ambiguous and appear to vary by country and institution (Battisti et al., 2022). The Commission’s Technological change and the future of work inquiry report (NZPC, 2019), provides more information on this subject.
The net benefits of productivity growth for individuals depend on their personal circumstances and their current skills and experience. For example, where industries compete against overseas producers, the benefits from improved productivity manifesting in lower prices and new products may go to consumers, but not to domestic firms and their workers. The process of resource reallocation – where some firms close or shrink and others expand – can be disruptive to families, communities, industries, and regions, especially those with few other choices.
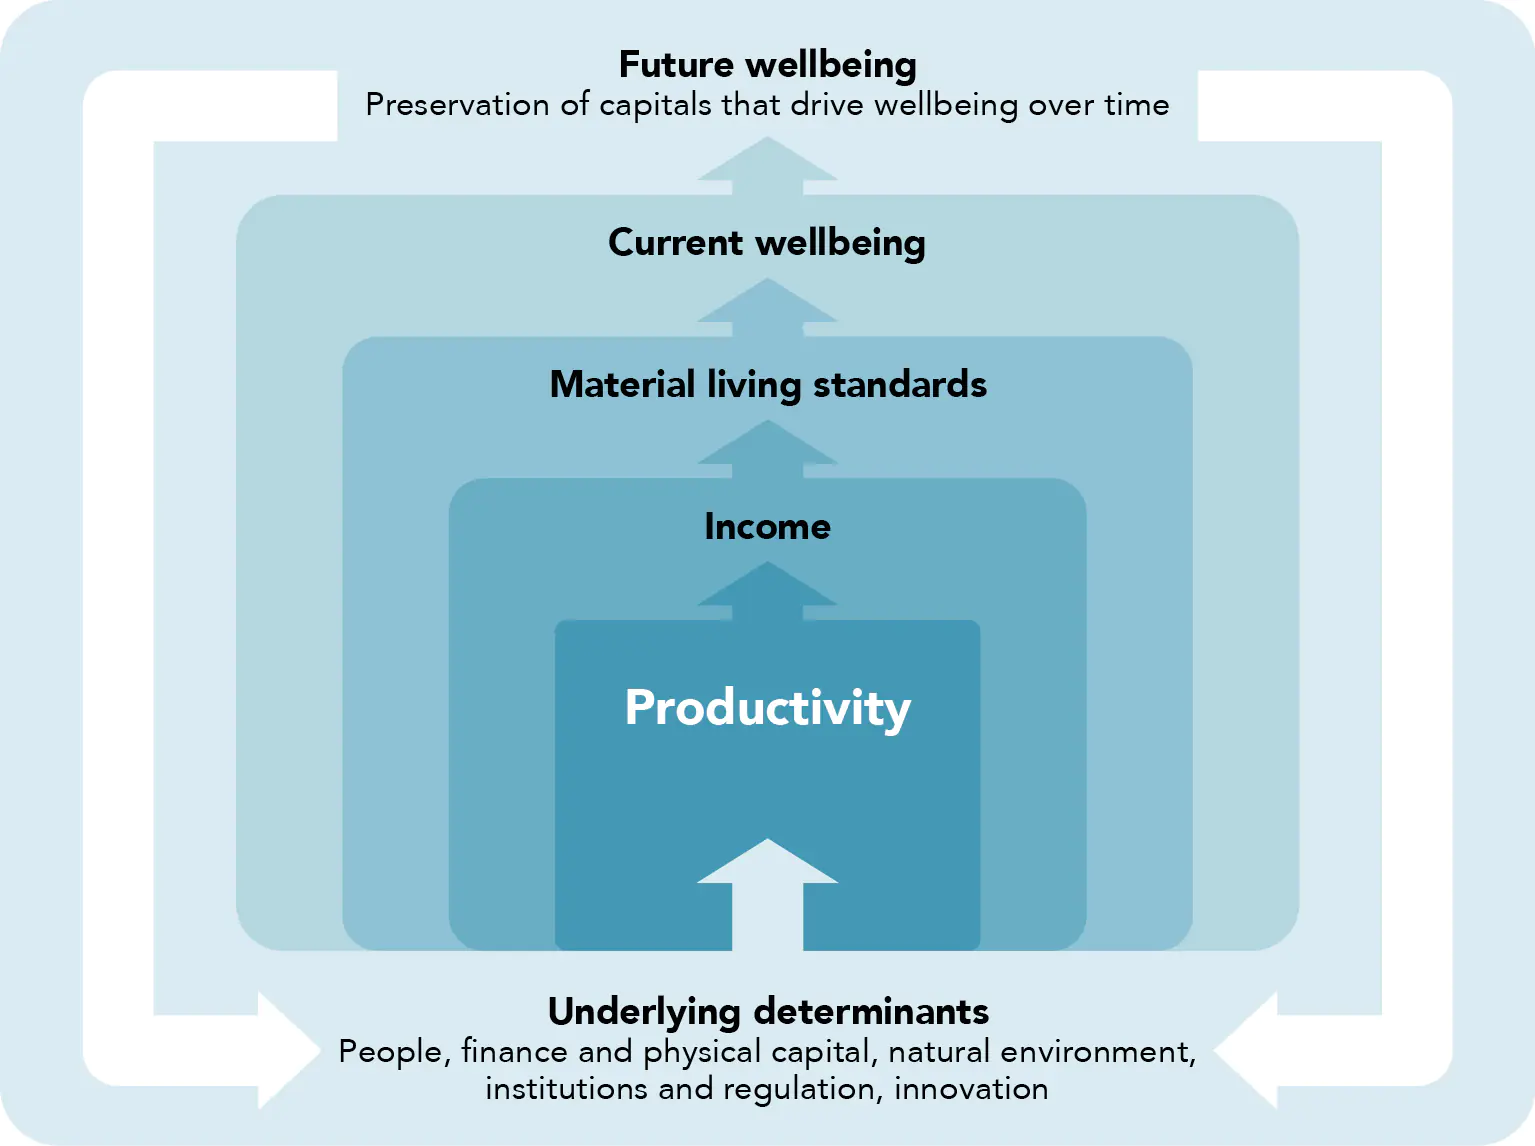
Productivity growth is important for overall income growth.
… real wages firms pay their workers increase more rapidly when productivity growth is strong and that higher real wage increases are more likely in high-productivity growth industries.
Fraser (2018)
International studies show that the lowest decile/quintile of workers within a country benefit at least as much as the average worker from economic growth (that is, inequality does not tend to increase with economic growth at many stages of development) (Cerra et al., 2021; Dollar et al., 2015; Dollar & Kraay, 2002). Income growth not only directly matters for the material living standards of households, but it also enables governments to redistribute income and wealth to address inequality and hardship. However, tackling inequality and hardship requires an understanding of how people’s circumstances differ, in order to design and deliver effective policies (Davies et al., 2022).
Productivity growth plays a crucial role in improving our overall wellbeing by increasing the nation’s incomes and our ability to produce and afford the goods and services that underpin a happy, healthy life. It also gives us the option to work fewer hours and enjoy more free time. Additionally, higher incomes allow us to invest in public goods and services that benefit everyone, such as schools, hospitals, and infrastructure. Higher productivity promotes the growth and prosperity of Aotearoa New Zealand to safeguard our wellbeing, today and in the future. By providing more income to invest in our nation’s wealth and using our existing resources more efficiently and sustainably, we can create a brighter future and better quality of life for all New Zealanders.